Using the ATAR forecasting method (and template), create a forecast for the new Apple Homepod.
Use these sources as a reference.
please use this reference
1- https://www.apple.com/homepod/
2-https://www.youtube.com/watch?v=HSe52qHZQ6E&t=6s&ab_channel=MktgStudyGuide
as example how to work,
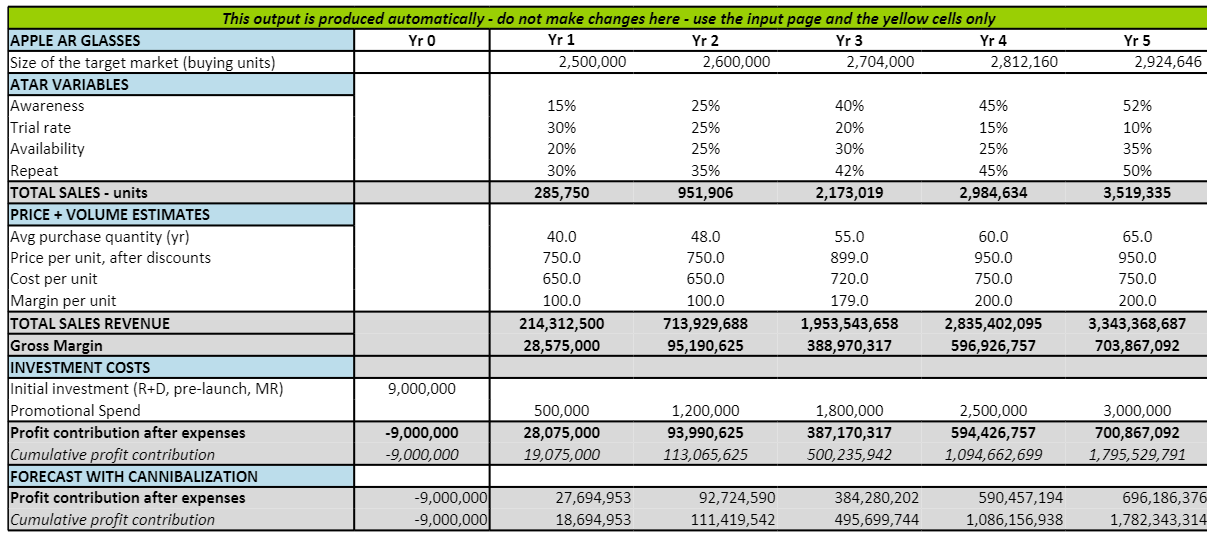
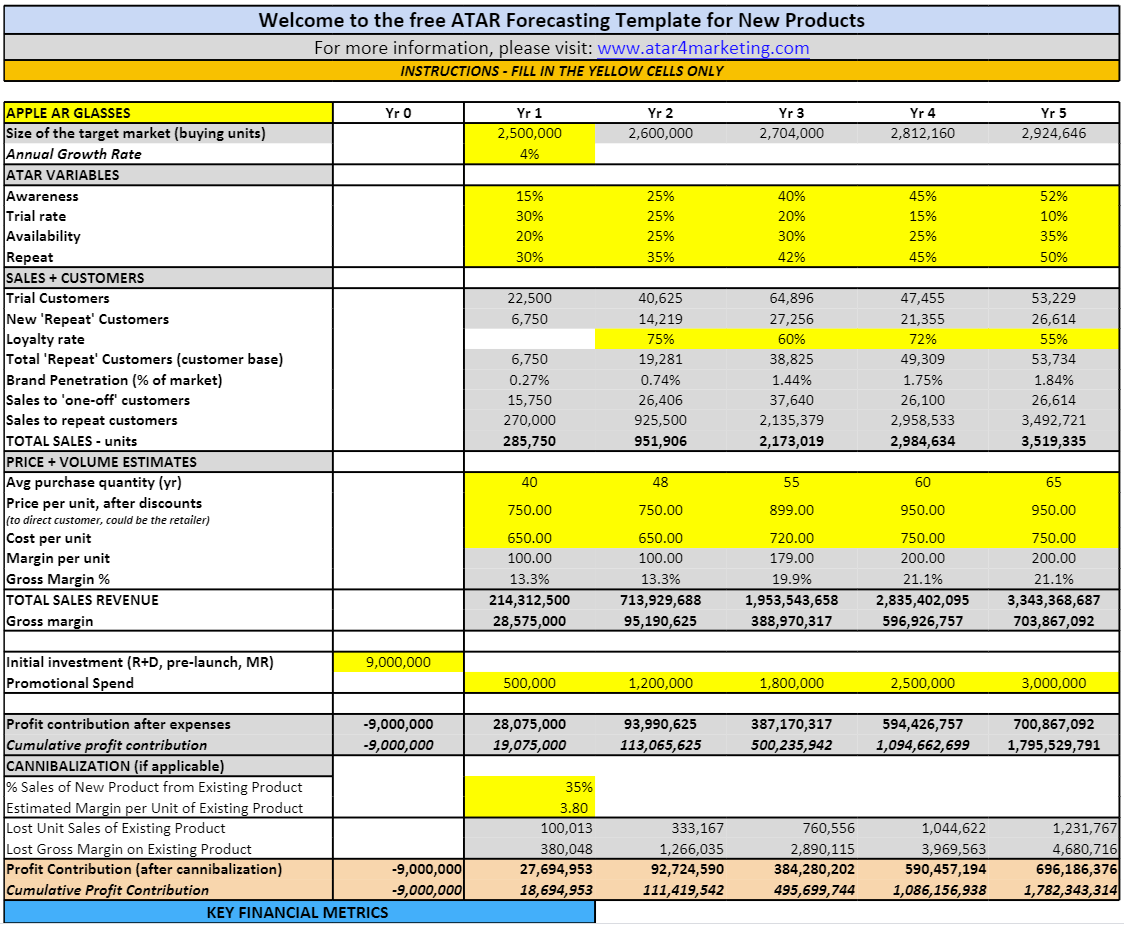
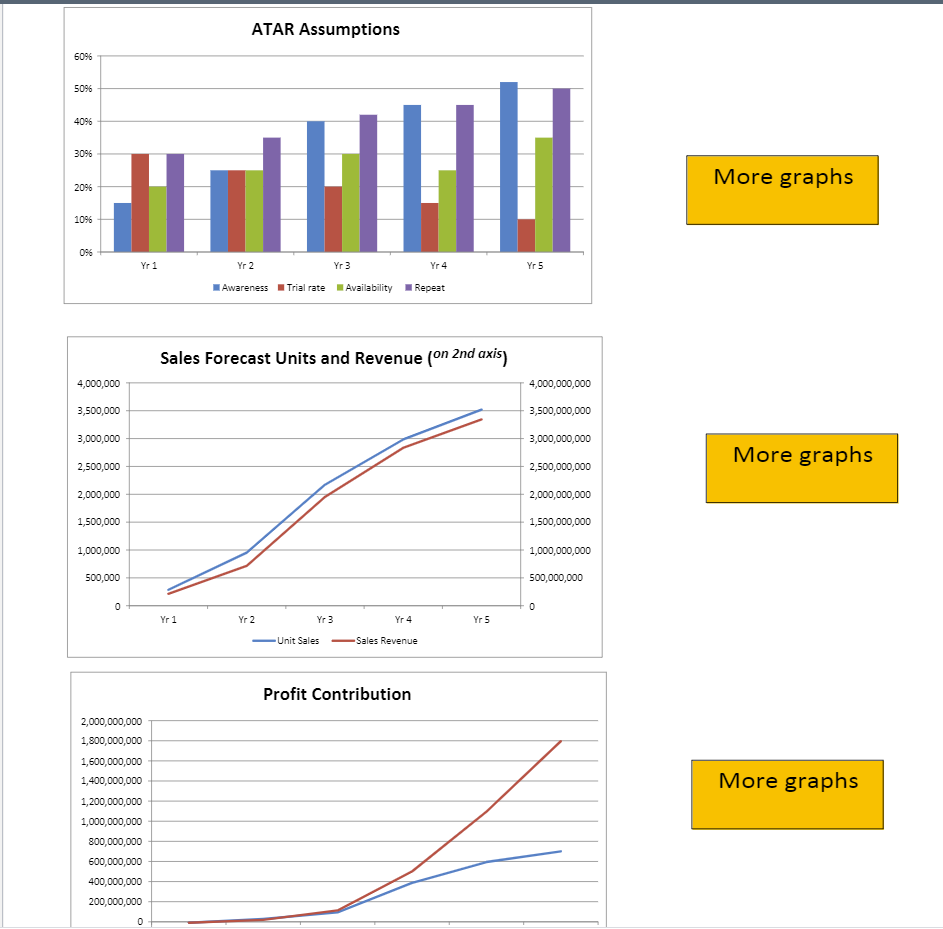
This output is produced automatically - do not make changes here - use the input page and the yellow cells only APPLE AR GLASSES Yro Yr 1 Yr 2 Yr 3 Yr 4 Yr 5 Size of the target market (buying units) 2,500,000 2,600,000 2,704,000 2,812,160 2,924,646 ATAR VARIABLES Awareness 15% 25% 40% 45% 52% Trial rate 30% 25% 20% 15% 10% Availability 20% 25% 30% 25% 35% Repeat 30% 35% 42% 45% 50% TOTAL SALES - units 285,750 951,906 2,173,019 2,984,634 3,519,335 PRICE + VOLUME ESTIMATES Avg purchase quantity (yr) 40.0 48.0 55.0 60.0 65.0 Price per unit, after discounts 750.0 750.0 899.0 950.0 950.0 Cost per unit 650.0 650.0 720.0 750.0 750.0 Margin per unit 100.0 100.0 179.0 200.0 200.0 TOTAL SALES REVENUE 214,312,500 713,929,688 1,953,543,658 2,835,402,095 3,343,368,687 Gross Margin 28,575,000 95,190,625 388,970,317 596,926,757 703,867,092 INVESTMENT COSTS Initial investment (R+D, pre-launch, MR) 9,000,000 Promotional Spend 500,000 1,200,000 1,800,000 2,500,000 3,000,000 Profit contribution after expenses -9,000,000 28,075,000 93,990,625 387,170,317 594,426,757 700,867,092 Cumulative profit contribution -9,000,000 19,075,000 113,065,625 500,235,942 1,094,662,699 1,795,529,791 FORECAST WITH CANNIBALIZATION Profit contribution after expenses -9,000,000 27,694,953 92,724,590 384,280,202 590,457,194 696,186,376 Cumulative profit contribution -9,000,000 18,694,953 111,419,542 495,699,744 1,086,156,938 1,782,343,314Welcome to the free ATAR Forecasting Template for New Products For more information, please visit: www.atar4marketing.com INSTRUCTIONS - FILL IN THE YELLOW CELLS ONLY APPLE AR GLASSES Yr 1 fr 2 /r 3 Yr 4 /r 5 Size of the target market (buying units) 2,500,000 2,600,000 2,704,000 2,812,160 2,924,646 Annual Growth Rate 4% ATAR VARIABLES Awareness 15% 25% 40% 45% 52% Trial rate 30% 25% 20% 15% 10% Availability 20% 25% 30% 25% 35% Repeat 30% 35% 12% 15% 50% SALES + CUSTOMERS Trial Customers 22,500 40,625 64,896 47,455 53,229 New 'Repeat' Customers 6,750 14,219 27,256 21,355 26,614 Loyalty rate 75% 60% 72% 55% Total 'Repeat' Customers (customer base) 6,750 19,281 38,825 49,309 53,734 Brand Penetration (% of market) 0.27% 0.74% 1.44% 1.75% 1.84% Sales to 'one-off customers 15,750 26,406 37,640 26,100 26,614 Sales to repeat customers 270,000 925,500 2,135,379 2,958,533 3,492,721 TOTAL SALES - units 285,750 951,906 2,173,019 2,984,634 3,519,335 PRICE + VOLUME ESTIMATES Avg purchase quantity (yr) 40 48 55 50 5 Price per unit, after discounts 750.00 750.00 899.00 950.00 950.00 (to direct customer, could be the retailer) Cost per unit 650.00 650.00 720.00 750.00 750.00 Margin per unit 100.00 100.00 179.00 200.00 200.00 Gross Margin % 13.3% 13.3% 19.9% 21.1% 21.1% TOTAL SALES REVENUE 214,312,500 713,929,688 1,953,543,658 2,835,402,095 3,343,368,687 Gross margin 28,575,000 95,190,625 388,970,317 596,926,757 703,867,092 Initial investment (R+D, pre-launch, MR) 9,000,000 Promotional Spend 500,000 1,200,000 1,800,000 2,500,000 3,000,000 Profit contribution after expenses 9,000,000 28,075,000 93,990,625 387,170,317 594,426,757 700,867,092 Cumulative profit contribution -9,000,000 19,075,000 113,065,625 500,235,942 1,094,662,699 1,795,529,791 CANNIBALIZATION (if applicable) % Sales of New Product from Existing Product 35% Estimated Margin per Unit of Existing Product 3.80 Lost Unit Sales of Existing Product 100,013 333,167 760,556 1,044,622 1,231,767 Lost Gross Margin on Existing Product 380,048 1,266,035 2,890,115 3,969,563 4,680,716 Profit Contribution (after cannibalization) 9,000,000 27,694,953 92,724,590 384,280,202 590,457,194 696,186,376 Cumulative Profit Contribution -9,000,000 18,694,953 111,419,542 495,699,744 1,086,156,938 1,782,343,314 KEY FINANCIAL METRICSATAR Assumptions 6096 5096 4096 3096 More graphs 2096 1096 Yr 1 Yr 2 Yr 3 Yr 4 Yr 5 Awareness .Trial rate Availability Repeat Sales Forecast Units and Revenue (on 2nd axis) 4,000,000 4,000,000,000 3,500,000 3,500,000,000 3,000,000 3,000,000,000 More graphs 2,500,000 2,500,000,000 2,000,000 2,000,000,000 1,500,000 1,500,000,000 1,000,000 1,000,000,000 500,000 500,000,000 0 0 Yr 1 Yr 2 Yr 3 Yr 4 Yr 5 Unit Sales Sales Revenue Profit Contribution 2,000,000,000 1,800,000,000 1,600,000,000 1,400,000,000 More graphs 1,200,000,000 1,000,000,000 800,000,000 600,000,000 400,000,000 200,000,000


