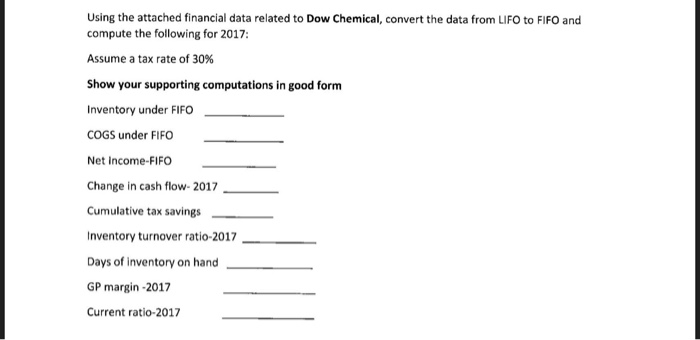
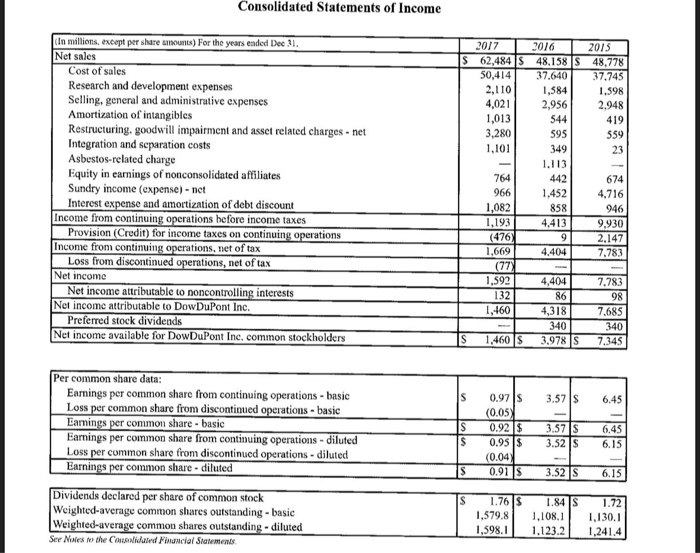
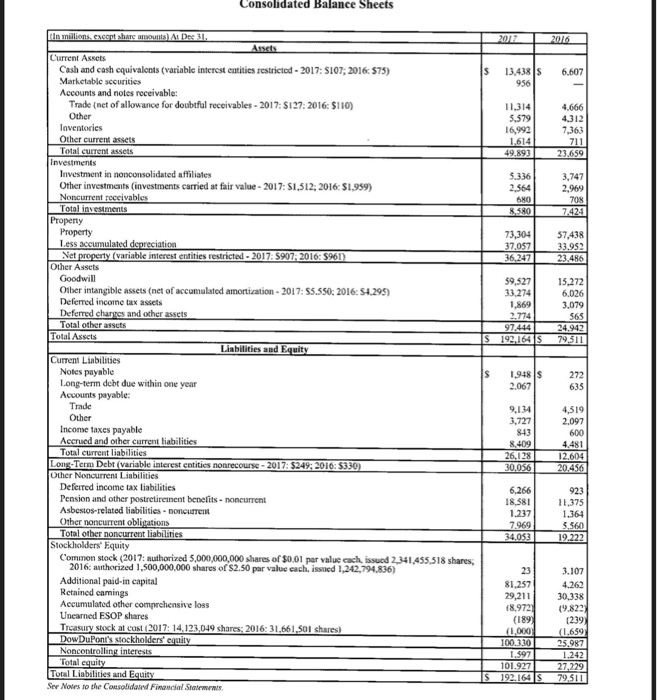
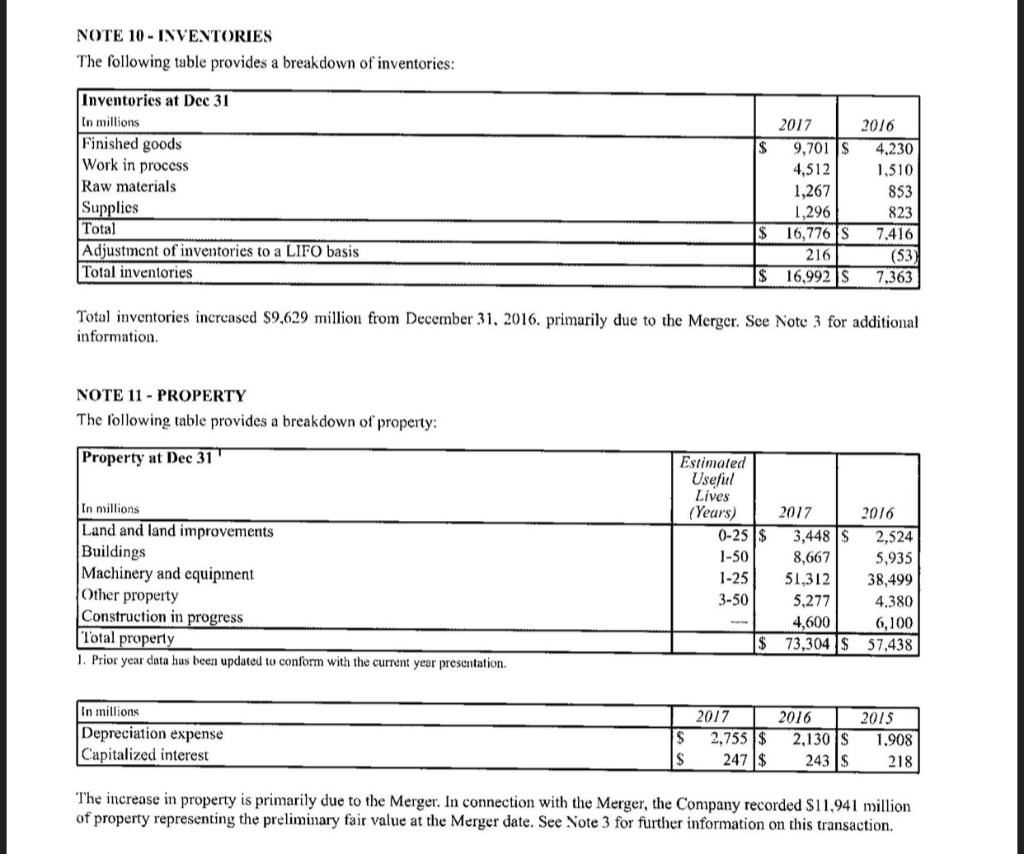
Using the attached financial data related to Dow Chemical, convert the data from LIFO to FIFO and compute the following for 2017 Assume a tax rate of 30% Show your supporting computations in good form Inventory under FIFO COGS under FIFO Net income-FIFO Change in cash flow- 2017 Cumulative tax savings Inventory turnover ratio-2017 Days of inventory on hand GP margin -2017 Current ratio-2017 Consolidated Statements of Income In millions, except per share aounts) For the years eaded Dec 3 Net sales 016 2015 Cost of sales Research and development expenses Selling, general and administrative expenses Amortization of intangibles Restructuring. goodwill impairment and asset related charges-net Integration and scparation costs Asbestos-related charge Equity in earnings of nonconsolidated affiliates Sundry income (cxpense) -nct Interest ex 62,484 IS 48, I 58 |$ 48.778 50,41437.640 37.745 1,598 2.948 419 559 23 2,110 4,021 1,013 3,280 1,101 1,584 2,956 544 595 349 1.113 442 1,452 858 4.413 764 966 1,082 1,193 (476 1,669 (77 1,592 132 1,460 674 4.716 946 9,930 2.147 7.783 e and amortization of debt discount Income from continuin rations before income taxes Provision (Credit) for income taxes on continuin Loss from discontinued operations, net of tax Net income attributable to noncontrolling interests Preferred stock dividends rations Income from continuin tions, net of tax 4.404 Net income 7.783 98 7.685 340 S 1460$ 3,978 S 7.345 4.404 86 4,318 340 Net income attributable to DowDuPont Inc Net income available for DowDuPont Inc, common stockholders Per common share data Earmings per common share from continuing operations basic Loss per common share from discontinued Earnings per common share basic Eanings per common share from continuing operations- diluted Loss per common share from discontinucd o Earnings per common share-diluted 0.97 3.57 6.45 ons basic (0.05 S 0.923.576.45 0.95 s 3.52 S 6.15 ions diluted 0.04 0.91 |$ 3.52 is 6.15 Dividends declared per share of common stock Weighted-average common shares outstanding - basic Weighted-average common shares outstanding - diluted See Nates to the Cooiduted Finaucial Siatements 1.76 S 84 S 1.72 1579.8108.,130.1 1,598.1.123.2 1,241.4 Consolidated Balance Sheets Current Assets Cash and cash equivalonts (variable intercst entities restrictod-2017: S107,2016 $75) S 13.438 S 6.607 956 Accounts and notes receivable: Trade (net of allowance for doubtful receivables 2017: $127:2016: $110) 11.314 5,579 16,992 4.312 7,363 Other current assets Total curent assets 3,747 2,969 Other investments (investments carried at fair value 2017: S1,512: 2016: $1.959) 2,564 73,30457,438 33.952 23.486 Less accumulated de variable interest entities restricted- 2017: S907 2016: $961 6,24 Other Assets 59,52715272 6.026 3,079 565 4,942 Oher intangible assets (net of accumulated amortiation-2017: S5.550: 2016:S4.295) Deferred incone tax assets and other assets .774 Total other assets Liabilities and Equit Current Liabilities Notes payable Long-term debt due within one year Accounts payable: S 948 $272 635 2.067 Trade 9,134 3,727 843 8,409 4,319 Income taxes payable Accrued and other current tiabilities Total current liabilities ng-Term Debt (variable interest entities nonrecourse 2017: $249: 2016: $330 600 4.481 30,0 Other Noncurrent Liabilities Deferred income tax liabilities Pension and other postretirenent benelits noncurrert Asbestos-related liabilities noncusren Other noncurrent obl Total otber noncurrent liabilities 6,266 18,581 11,375 1364 ,560 7969 4.053 Stockholders Equity Common stock (2017: authorized 5,000,000,000 shares of $0.01 par value cach issued 2,341 455.518 shares, 2016: athorized 1,500,000,000 shares of $2.50 par value each, issued 1,242,794,836) Additional paid-in capital Rctained camings Accumulated other comprchensive loss Unearned ESOP shares Treasury stock al cost (2017: 14.123,049 shares:2016:31.661.501 shares Dow DuPont's stockholders' e 3.107 4.262 29,21130,338 9.822 (239 1.659 81,257 18,972 (189 1,000 1,242 101 92727.229 Totsl Liabalities and Equit Ser Notes to the Consolidated Financial Statemens NOTE 10-INVENTORIES The following table provides a breakdown of inventories Inventories at Dec 31 [n millions Finished goods Work in process Raw materials Supplics Total Adjustmcnt of inventories to a LIFO basis Total inventories 2017 2016 S9,701 4.230 1.510 853 823 16,776 IS 7.416 4,512 1,267 1,296 216 $ 16,992 S 7,363 Total inventories increased S9.629 million from December 3 2016. primarily due to the Merger. Sce Note 3 for additional information NOTE 11 PROPERTY The following table provides a breakdown of property Property at Dec 31 Estimated Usefiul Lives In millions Land and land improvements Buildings Machinery and equipment Other property Construction in progress l'otal property . Prior year data has been updated to conform with the current year presentation. Years) 2017 2016 0-253,448 S 2,524 5,935 1-2551,312 38,499 4.380 6,100 $ 73,304 57.438 1-50 8,667 3-50 5,277 4,600 In millions Depreciation expense Capitalized interest 2017 2016 2015 S 2,755 2.130 s 1.908 S247$243 218 The increase in property is primarily due to the Merger. In connection with the Merger, the Company recorded S11.941 million of property representing the preliminary fair value at the Merger date. See Note 3 for further information on this transaction. Using the attached financial data related to Dow Chemical, convert the data from LIFO to FIFO and compute the following for 2017 Assume a tax rate of 30% Show your supporting computations in good form Inventory under FIFO COGS under FIFO Net income-FIFO Change in cash flow- 2017 Cumulative tax savings Inventory turnover ratio-2017 Days of inventory on hand GP margin -2017 Current ratio-2017 Consolidated Statements of Income In millions, except per share aounts) For the years eaded Dec 3 Net sales 016 2015 Cost of sales Research and development expenses Selling, general and administrative expenses Amortization of intangibles Restructuring. goodwill impairment and asset related charges-net Integration and scparation costs Asbestos-related charge Equity in earnings of nonconsolidated affiliates Sundry income (cxpense) -nct Interest ex 62,484 IS 48, I 58 |$ 48.778 50,41437.640 37.745 1,598 2.948 419 559 23 2,110 4,021 1,013 3,280 1,101 1,584 2,956 544 595 349 1.113 442 1,452 858 4.413 764 966 1,082 1,193 (476 1,669 (77 1,592 132 1,460 674 4.716 946 9,930 2.147 7.783 e and amortization of debt discount Income from continuin rations before income taxes Provision (Credit) for income taxes on continuin Loss from discontinued operations, net of tax Net income attributable to noncontrolling interests Preferred stock dividends rations Income from continuin tions, net of tax 4.404 Net income 7.783 98 7.685 340 S 1460$ 3,978 S 7.345 4.404 86 4,318 340 Net income attributable to DowDuPont Inc Net income available for DowDuPont Inc, common stockholders Per common share data Earmings per common share from continuing operations basic Loss per common share from discontinued Earnings per common share basic Eanings per common share from continuing operations- diluted Loss per common share from discontinucd o Earnings per common share-diluted 0.97 3.57 6.45 ons basic (0.05 S 0.923.576.45 0.95 s 3.52 S 6.15 ions diluted 0.04 0.91 |$ 3.52 is 6.15 Dividends declared per share of common stock Weighted-average common shares outstanding - basic Weighted-average common shares outstanding - diluted See Nates to the Cooiduted Finaucial Siatements 1.76 S 84 S 1.72 1579.8108.,130.1 1,598.1.123.2 1,241.4 Consolidated Balance Sheets Current Assets Cash and cash equivalonts (variable intercst entities restrictod-2017: S107,2016 $75) S 13.438 S 6.607 956 Accounts and notes receivable: Trade (net of allowance for doubtful receivables 2017: $127:2016: $110) 11.314 5,579 16,992 4.312 7,363 Other current assets Total curent assets 3,747 2,969 Other investments (investments carried at fair value 2017: S1,512: 2016: $1.959) 2,564 73,30457,438 33.952 23.486 Less accumulated de variable interest entities restricted- 2017: S907 2016: $961 6,24 Other Assets 59,52715272 6.026 3,079 565 4,942 Oher intangible assets (net of accumulated amortiation-2017: S5.550: 2016:S4.295) Deferred incone tax assets and other assets .774 Total other assets Liabilities and Equit Current Liabilities Notes payable Long-term debt due within one year Accounts payable: S 948 $272 635 2.067 Trade 9,134 3,727 843 8,409 4,319 Income taxes payable Accrued and other current tiabilities Total current liabilities ng-Term Debt (variable interest entities nonrecourse 2017: $249: 2016: $330 600 4.481 30,0 Other Noncurrent Liabilities Deferred income tax liabilities Pension and other postretirenent benelits noncurrert Asbestos-related liabilities noncusren Other noncurrent obl Total otber noncurrent liabilities 6,266 18,581 11,375 1364 ,560 7969 4.053 Stockholders Equity Common stock (2017: authorized 5,000,000,000 shares of $0.01 par value cach issued 2,341 455.518 shares, 2016: athorized 1,500,000,000 shares of $2.50 par value each, issued 1,242,794,836) Additional paid-in capital Rctained camings Accumulated other comprchensive loss Unearned ESOP shares Treasury stock al cost (2017: 14.123,049 shares:2016:31.661.501 shares Dow DuPont's stockholders' e 3.107 4.262 29,21130,338 9.822 (239 1.659 81,257 18,972 (189 1,000 1,242 101 92727.229 Totsl Liabalities and Equit Ser Notes to the Consolidated Financial Statemens NOTE 10-INVENTORIES The following table provides a breakdown of inventories Inventories at Dec 31 [n millions Finished goods Work in process Raw materials Supplics Total Adjustmcnt of inventories to a LIFO basis Total inventories 2017 2016 S9,701 4.230 1.510 853 823 16,776 IS 7.416 4,512 1,267 1,296 216 $ 16,992 S 7,363 Total inventories increased S9.629 million from December 3 2016. primarily due to the Merger. Sce Note 3 for additional information NOTE 11 PROPERTY The following table provides a breakdown of property Property at Dec 31 Estimated Usefiul Lives In millions Land and land improvements Buildings Machinery and equipment Other property Construction in progress l'otal property . Prior year data has been updated to conform with the current year presentation. Years) 2017 2016 0-253,448 S 2,524 5,935 1-2551,312 38,499 4.380 6,100 $ 73,304 57.438 1-50 8,667 3-50 5,277 4,600 In millions Depreciation expense Capitalized interest 2017 2016 2015 S 2,755 2.130 s 1.908 S247$243 218 The increase in property is primarily due to the Merger. In connection with the Merger, the Company recorded S11.941 million of property representing the preliminary fair value at the Merger date. See Note 3 for further information on this transaction