Answered step by step
Verified Expert Solution
Link Copied!

Question

1 Approved Answer

using the chart; discuss the key drivers behind the price, volume, cost and/or productivity variances. minimum 120 words Pre-tax NI Walk: Plan vs. Actual :

using the chart; discuss the key drivers behind the price, volume, cost and/or productivity variances. minimum 120 words
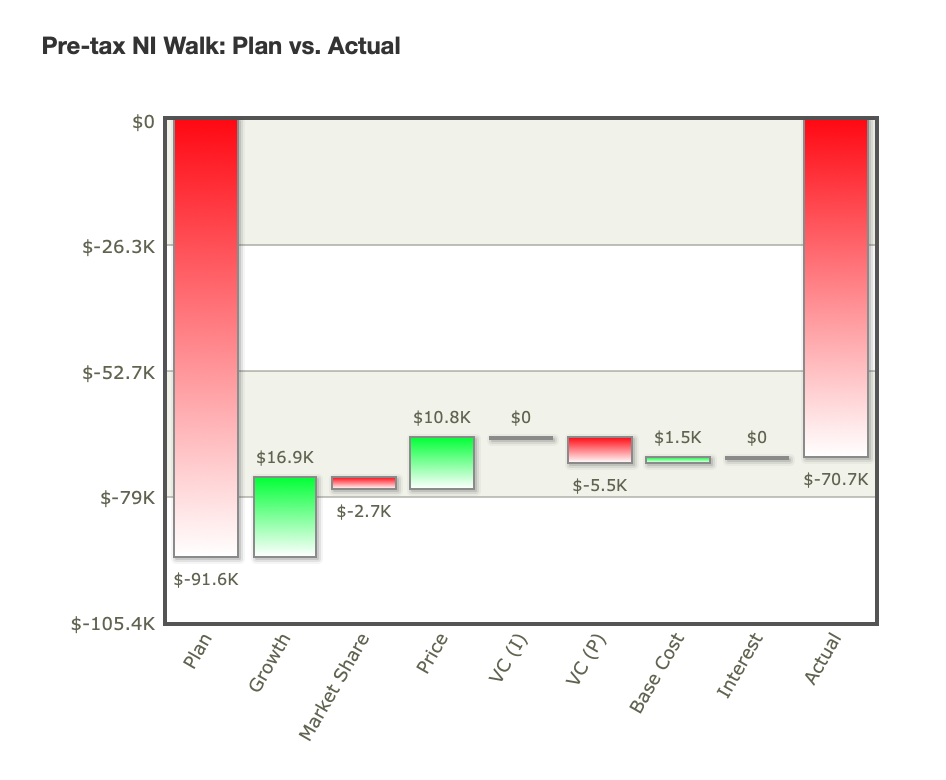
image text in transcribed

Pre-tax NI Walk: Plan vs. Actual : $0 $-26.3K $-52.7K $10.8K $0 $1.5K $0 $16.9K $-5.5K $-70.7K $-79K $-2.7K $-91.6K $-105.4K Plan Growth Price VC (I) VC (P) Market Share Base Cost Interest Actual Pre-tax NI Walk: Plan vs. Actual : $0 $-26.3K $-52.7K $10.8K $0 $1.5K $0 $16.9K $-5.5K $-70.7K $-79K $-2.7K $-91.6K $-105.4K Plan Growth Price VC (I) VC (P) Market Share Base Cost Interest Actual

Step by Step Solution

There are 3 Steps involved in it

Step: 1

blur-text-image

Get Instant Access to Expert-Tailored Solutions

See step-by-step solutions with expert insights and AI powered tools for academic success

Step: 2

blur-text-image

Step: 3

blur-text-image

Ace Your Homework with AI

Get the answers you need in no time with our AI-driven, step-by-step assistance

Get Started

Recommended Textbook for

Finance And Economics Discussion Series Measurement Error And Time Aggregation A Closer Look At Estimates Of Output Labor Elasticities

Authors: United States Federal Reserve Board, Marcello Estevao

1st Edition

1288722990, 9781288722990

More Books

Students also viewed these Finance questions