

Answered step by step
Verified Expert Solution
Question
1 Approved Answer
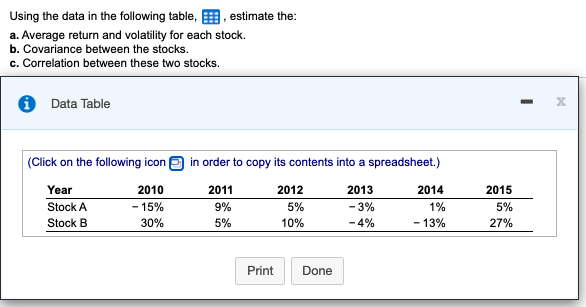
Using the data in the following table, , estimate the: a. Average return and volatility for each stock. b. Covariance between the stocks. c. Correlation
Step by Step Solution
There are 3 Steps involved in it
Step: 1

Get Instant Access to Expert-Tailored Solutions
See step-by-step solutions with expert insights and AI powered tools for academic success
Step: 2

Step: 3
Ace Your Homework with AI
Get the answers you need in no time with our AI-driven, step-by-step assistance
Get Started
An Evaluation Of The Benefits And Value Of Libraries
Authors: Nyström, Viveca , Sjögren, Linnéa
1st Edition
1843346869,1780632932