Answered step by step
Verified Expert Solution
Question
1 Approved Answer
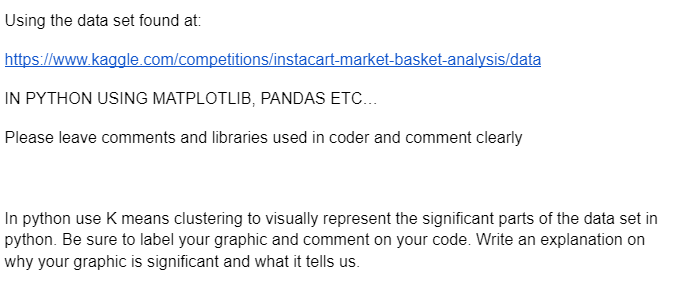
Using the data set found at: https://www.kaggle.com/competitions/instacart-market-basket-analysis/data In python use K means clustering to visually represent the significant parts of the data set in python.
Using the data set found at:
https://www.kaggle.com/competitions/instacart-market-basket-analysis/data

Step by Step Solution
There are 3 Steps involved in it
Step: 1

Get Instant Access to Expert-Tailored Solutions
See step-by-step solutions with expert insights and AI powered tools for academic success
Step: 2

Step: 3

Ace Your Homework with AI
Get the answers you need in no time with our AI-driven, step-by-step assistance
Get Started


