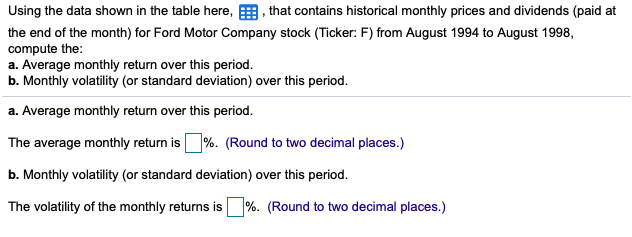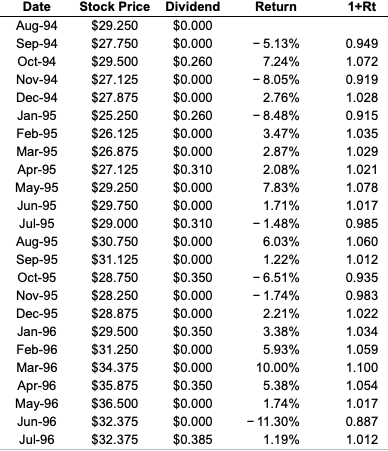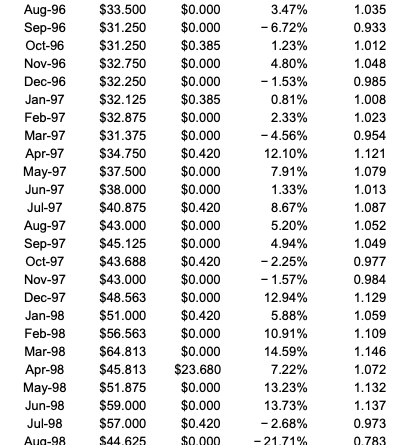


Using the data shown in the table here, that contains historical monthly prices and dividends (paid at the end of the month) for Ford Motor Company stock (Ticker: F) from August 1994 to August 1998, compute the: a. Average monthly return over this period. b. Monthly volatility (or standard deviation) over this period. a. Average monthly return over this period. The average monthly return is %. (Round to two decimal places.) b. Monthly volatility (or standard deviation) over this period. The volatility of the monthly returns is %. (Round to two decimal places.) Return 1+Rt Date Aug-94 Sep-94 Oct-94 Nov-94 Dec-94 Jan-95 Feb-95 Mar-95 Apr-95 May-95 Jun-95 Jul-95 Aug-95 Sep-95 Oct-95 Nov-95 Dec-95 Jan-96 Feb-96 Mar-96 Apr-96 May-96 Jun-96 Jul-96 Stock Price $29.250 $27.750 $29.500 $27.125 $27.875 $25.250 $26.125 $26.875 $27.125 $29.250 $29.750 $29.000 $30.750 $31.125 $28.750 $28.250 $28.875 $29.500 $31.250 $34.375 $35.875 $36.500 $32.375 $32.375 Dividend $0.000 $0.000 $0.260 $0.000 $0.000 $0.260 $0.000 $0.000 $0.310 $0.000 $0.000 $0.310 $0.000 $0.000 $0.350 $0.000 $0.000 $0.350 $0.000 $0.000 $0.350 $0.000 $0.000 $0.385 -5.13% 7.24% - 8.05% 2.76% -8.48% % 3.47% 2.87% 2.08% 7.83% 1.71% -1.48% 6.03% 1.22% - 6.51% -1.74% 2.21% 3.38% 5.93% 10.00% 5.38% 1.74% - 11.30% 1.19% 0.949 1.072 0.919 1.028 0.915 1.035 1.029 1.021 1.078 1.017 0.985 1.060 1.012 0.935 0.983 1.022 1.034 1.059 1.100 1.054 1.017 0.887 1.012 Aug-96 Sep-96 Oct-96 Nov-96 Dec-96 Jan-97 Feb-97 Mar-97 Apr-97 May-97 Jun-97 Jul-97 Aug-97 Sep-97 Oct-97 Nov-97 Dec-97 Jan-98 Feb-98 Mar-98 Apr-98 May-98 Jun-98 Jul-98 Aug-98 $33.500 $31.250 $31.250 $32.750 $32.250 $32.125 $32.875 $31.375 $34.750 $37.500 $38.000 $40.875 $43.000 $45.125 $43.688 $43.000 $48.563 $51.000 $56.563 $64.813 $45.813 $51.875 $59.000 $57.000 $44.625 $0.000 $0.000 $0.385 $0.000 $0.000 $0.385 $0.000 $0.000 $0.420 $0.000 $0.000 $0.420 $0.000 $0.000 $0.420 $0.000 $0.000 $0.420 $0.000 $0.000 $23.680 $0.000 $0.000 $0.420 $0.000 3.47% - 6.72% 1.23% 4.80% - 1.53% 0.81% 2.33% -4.56% 12.10% 7.91% 1.33% 8.67% 5.20% 4.94% -2.25% -1.57% 12.94% 5.88% 10.91% 14.59% 7.22% 13.23% 13.73% -2.68% - 21.71% 1.035 0.933 1.012 1.048 0.985 1.008 1.023 0.954 1.121 1.079 1.013 1.087 1.052 1.049 0.977 0.984 1.129 1.059 1.109 1.146 1.072 1.132 1.137 0.973 0.783


