

Question
Using the Excel Financial Forecast worksheet, determine the sensitivity of the model by adjusting the values of growth rate in sales and cost of goods
Using the Excel Financial Forecast worksheet, determine the sensitivity of the model by adjusting the values of growth rate in sales and cost of goods sold in column D. Increase and decreases the % values for 2017 and observe and record the results. Create an Excel chart for each (growth rate in sales and cost of goods sold) the resulting impact on external funding required.
I can create charts if you can help provide me with the numbers in an organized manner please! It is just for row D for the GROWTH RATE IN SALES and COST OF GOODS SOLD
Explain your observations on: I'm supposed to write 2 pages double spaced answering the following questions.
o How did adjusting growth rate of sale and cost of good sold affect the income statement and balance sheet? o What is External Funding Required and how was it affected by adjusting sales projections and cost of goods sold?
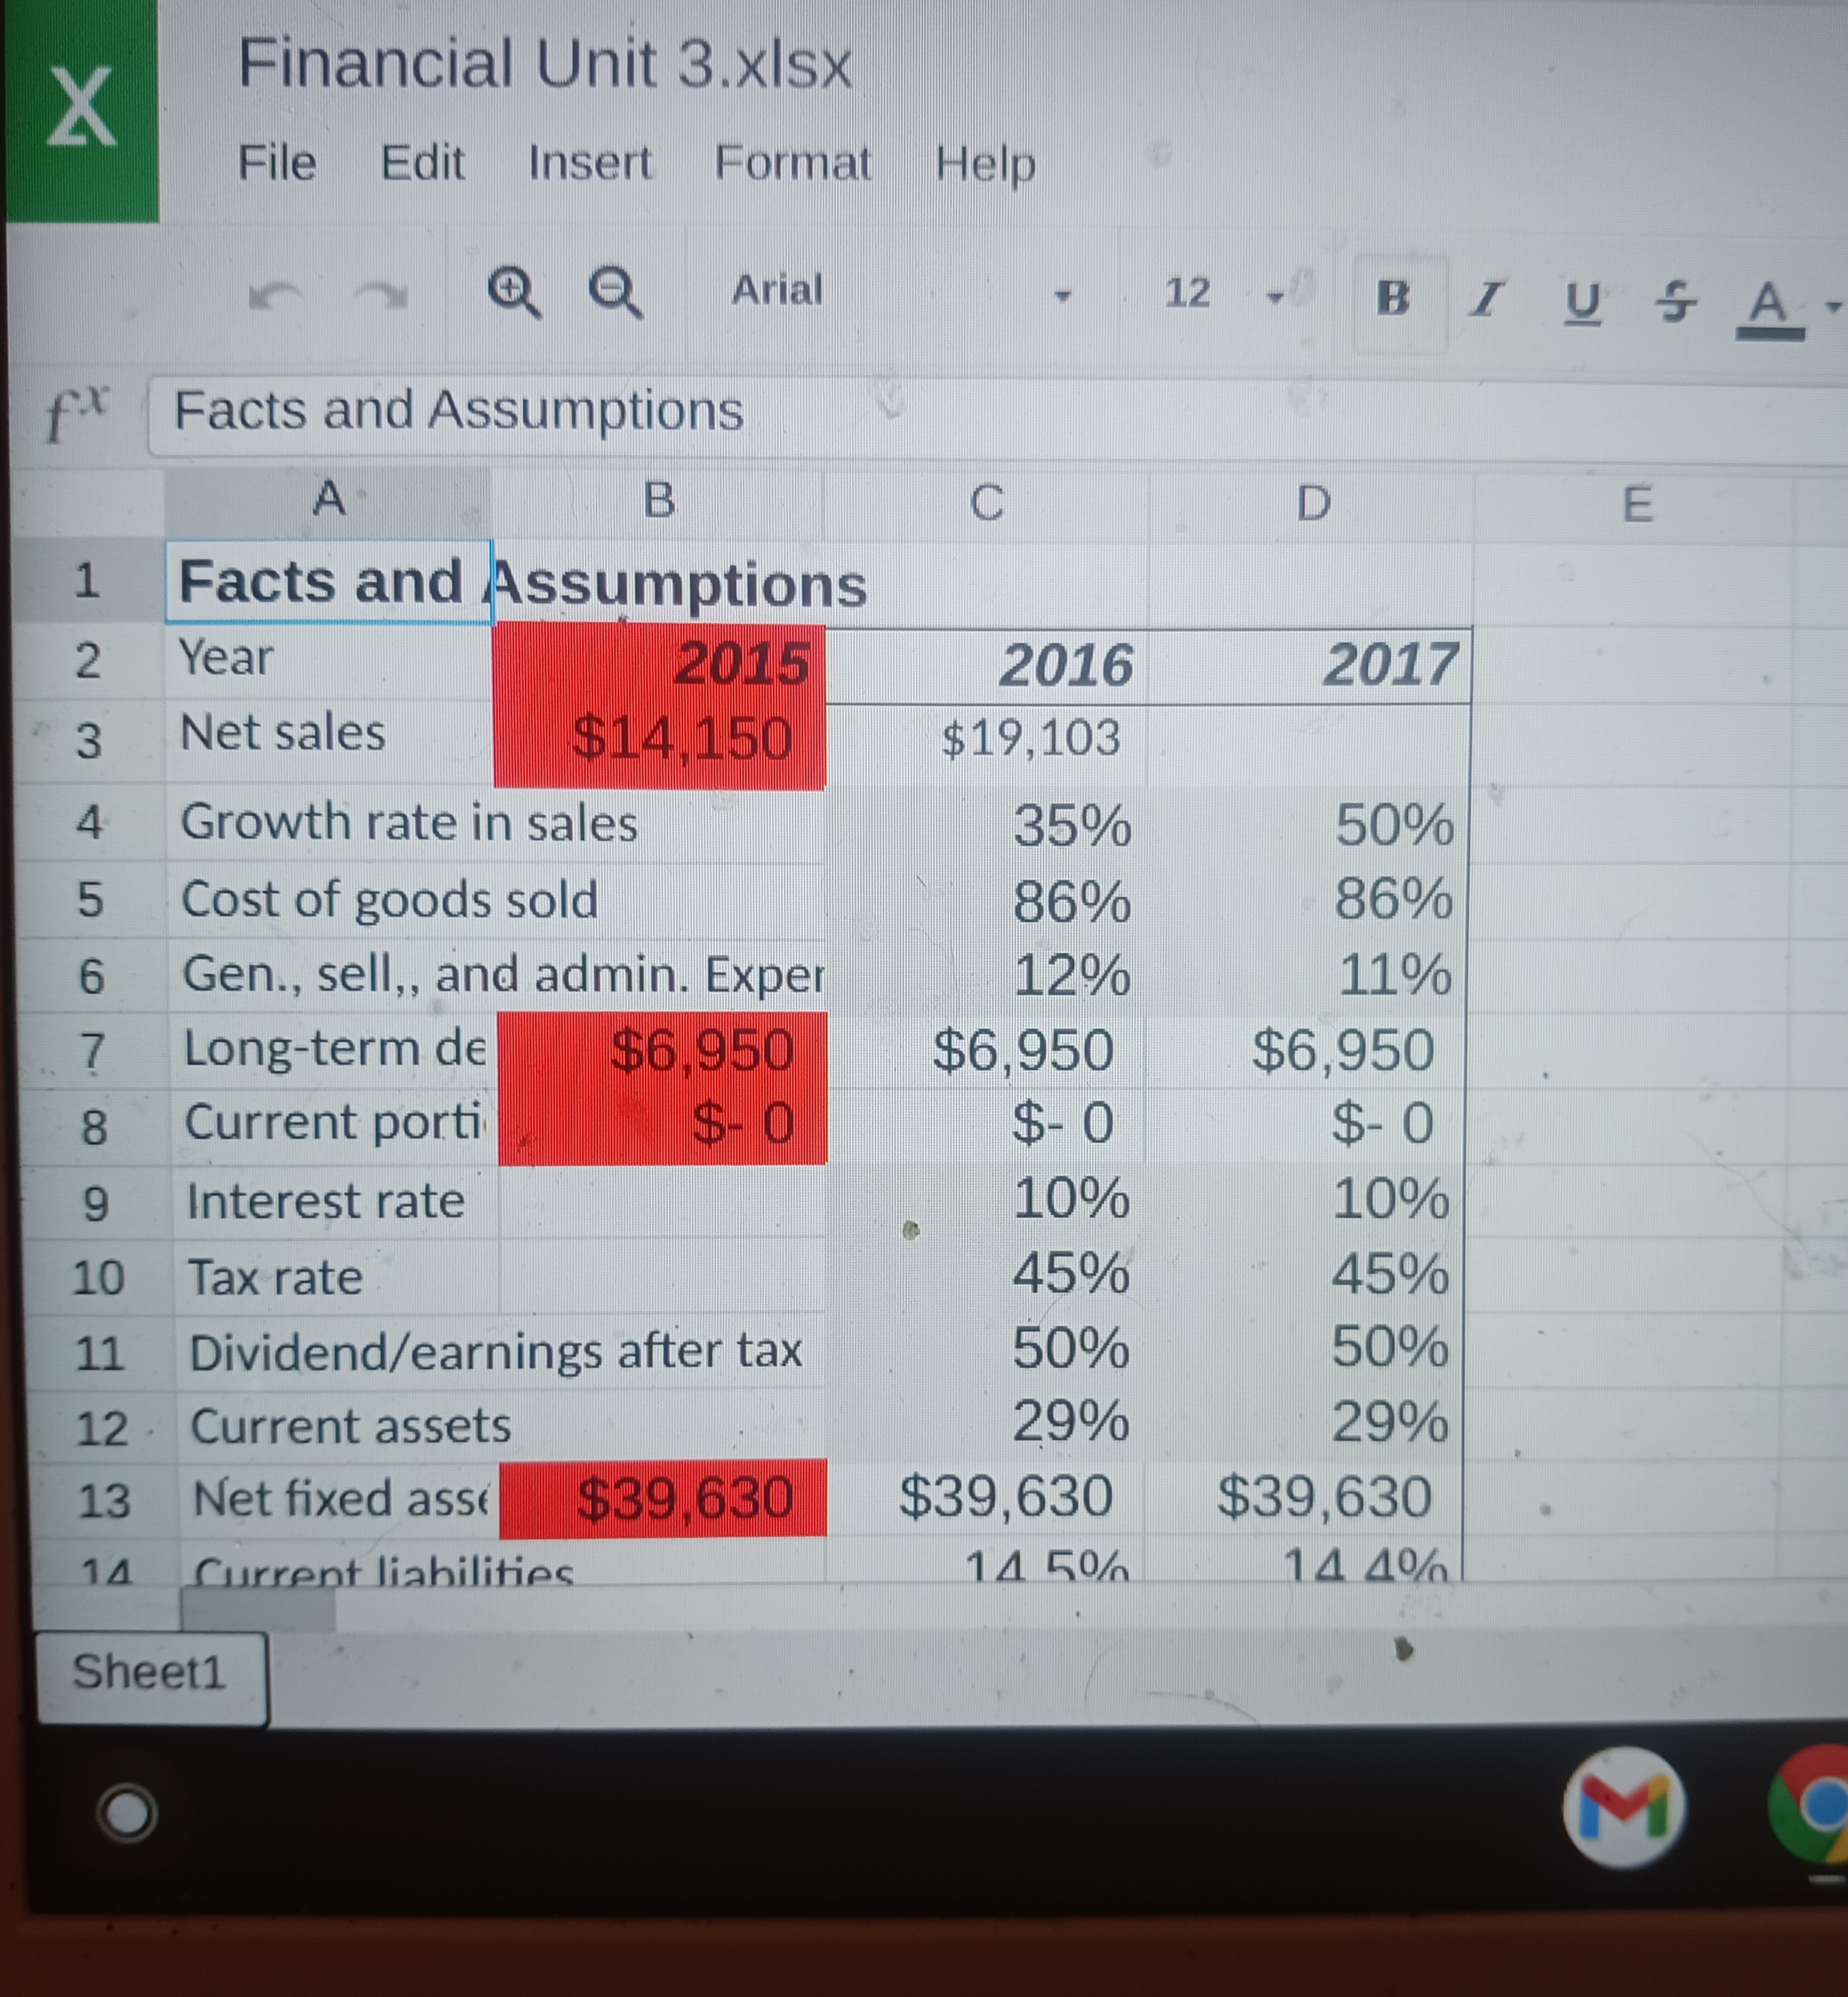
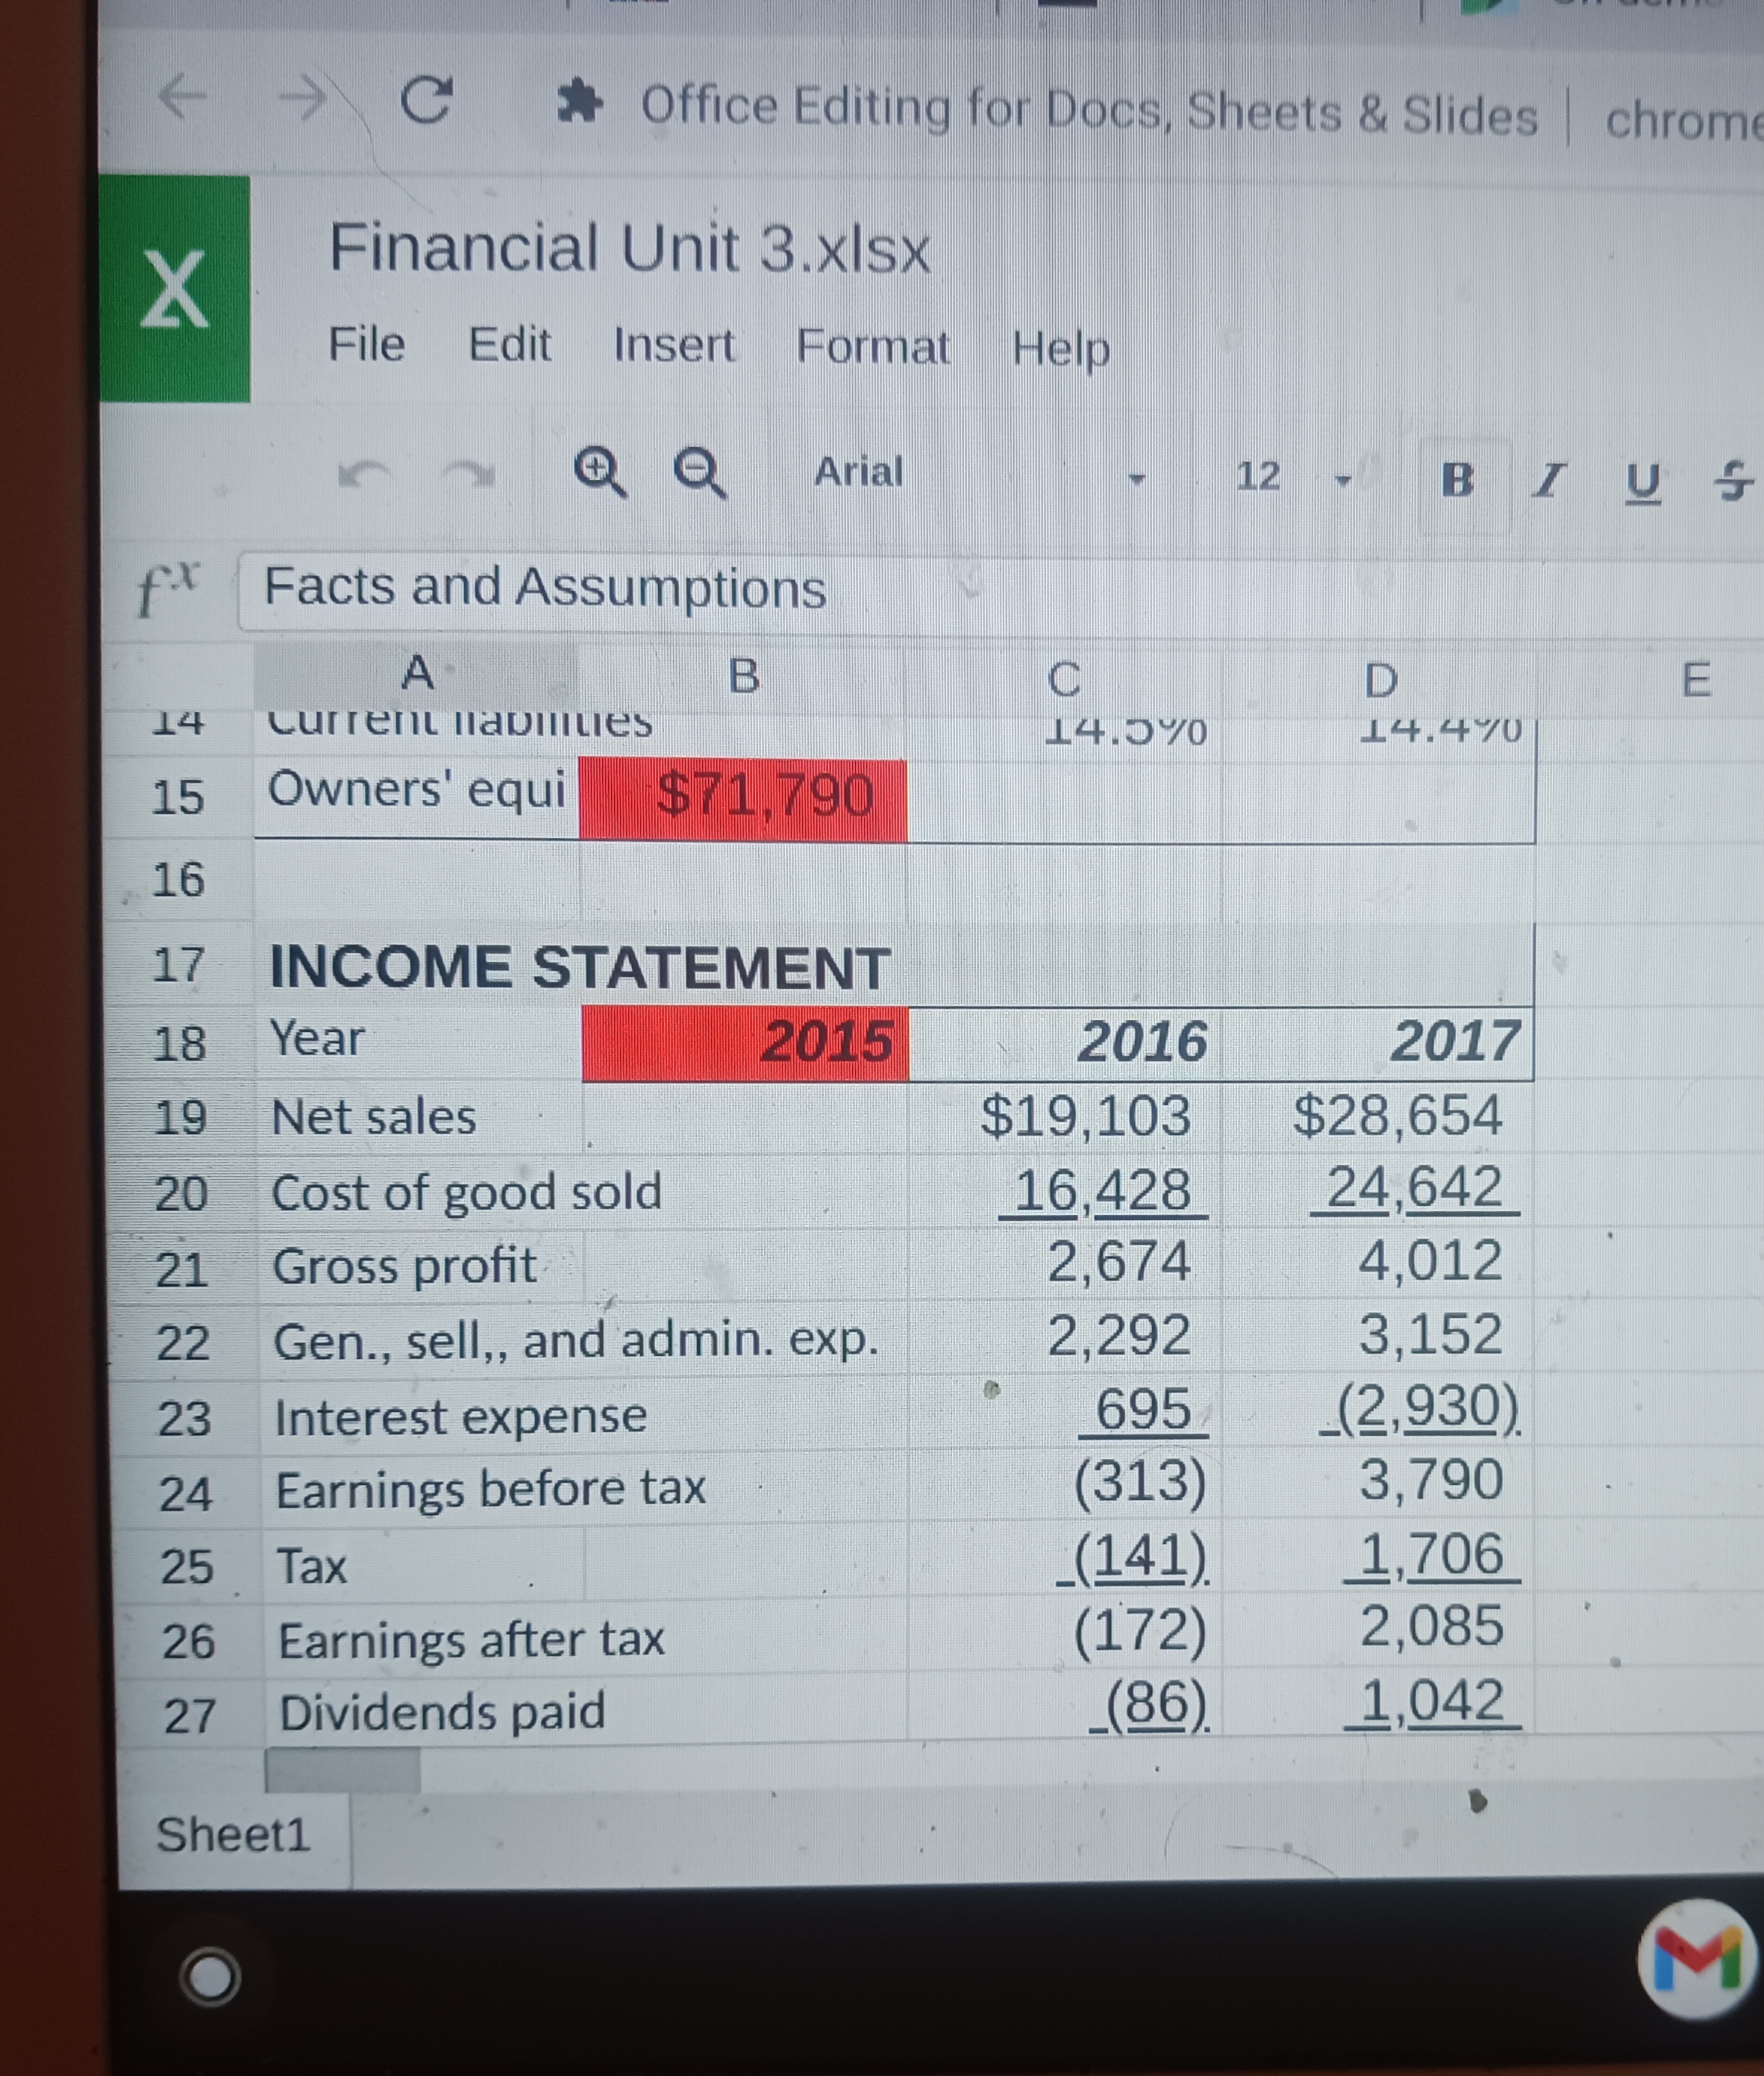
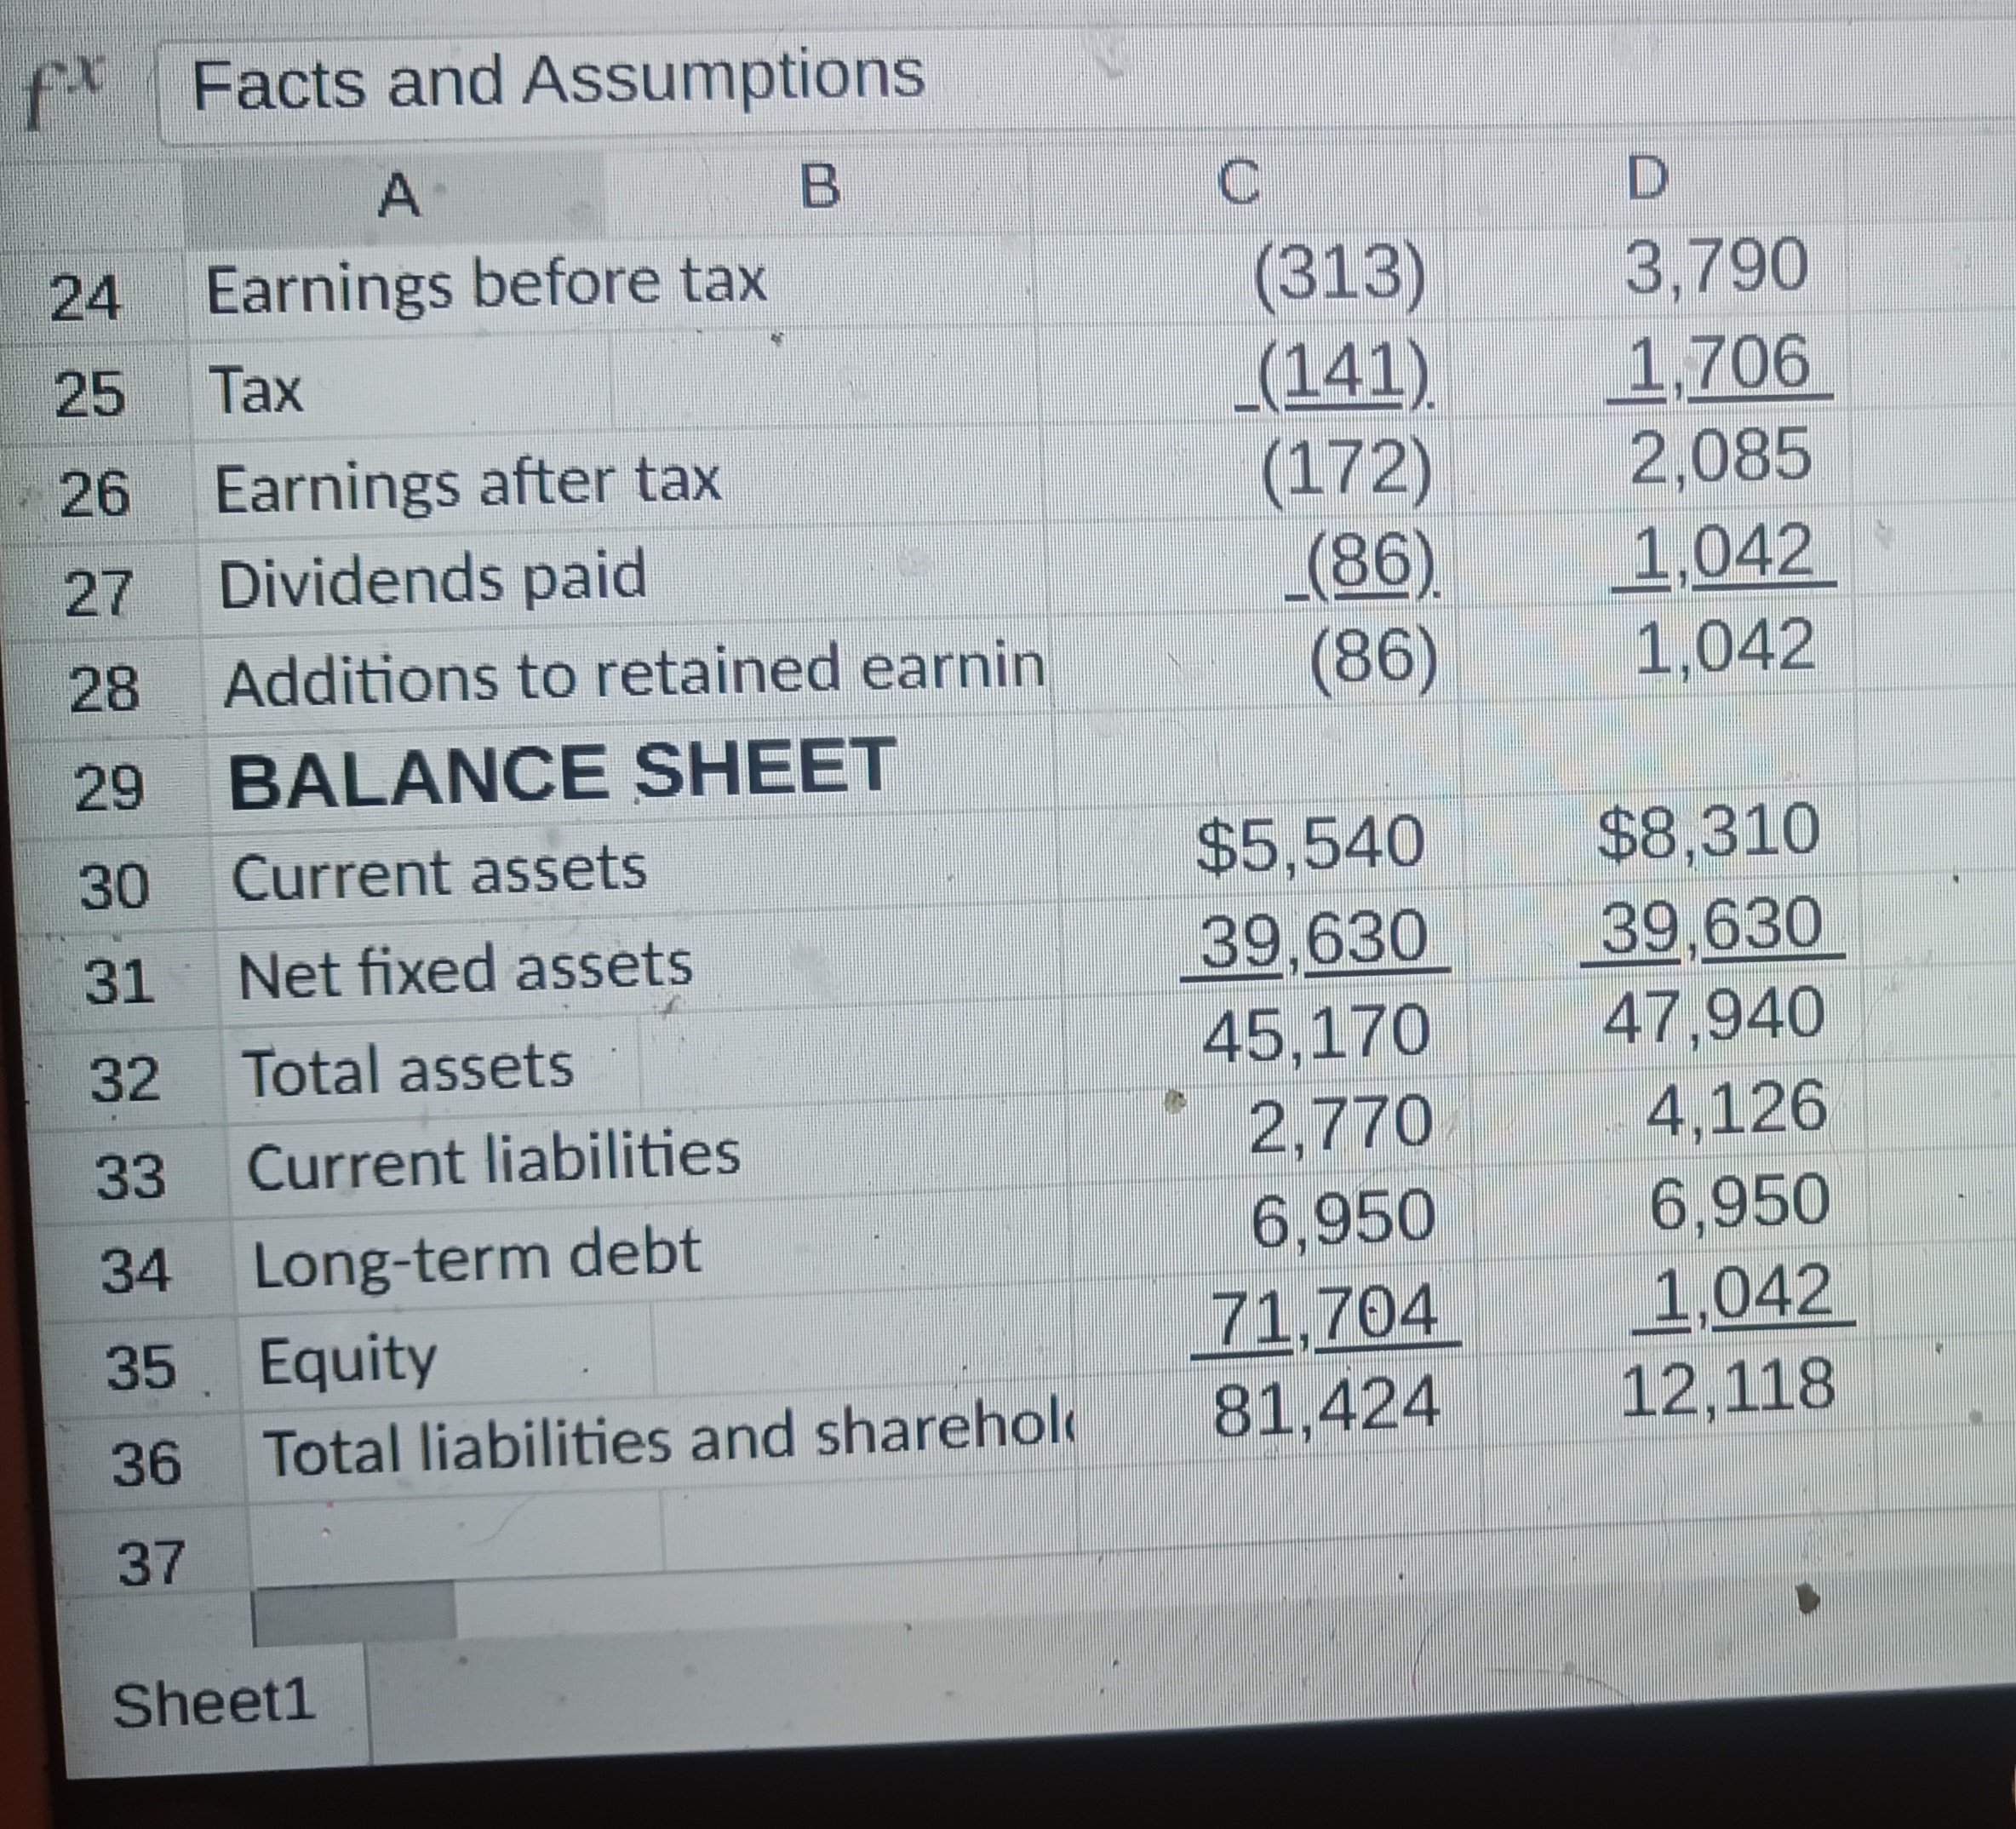
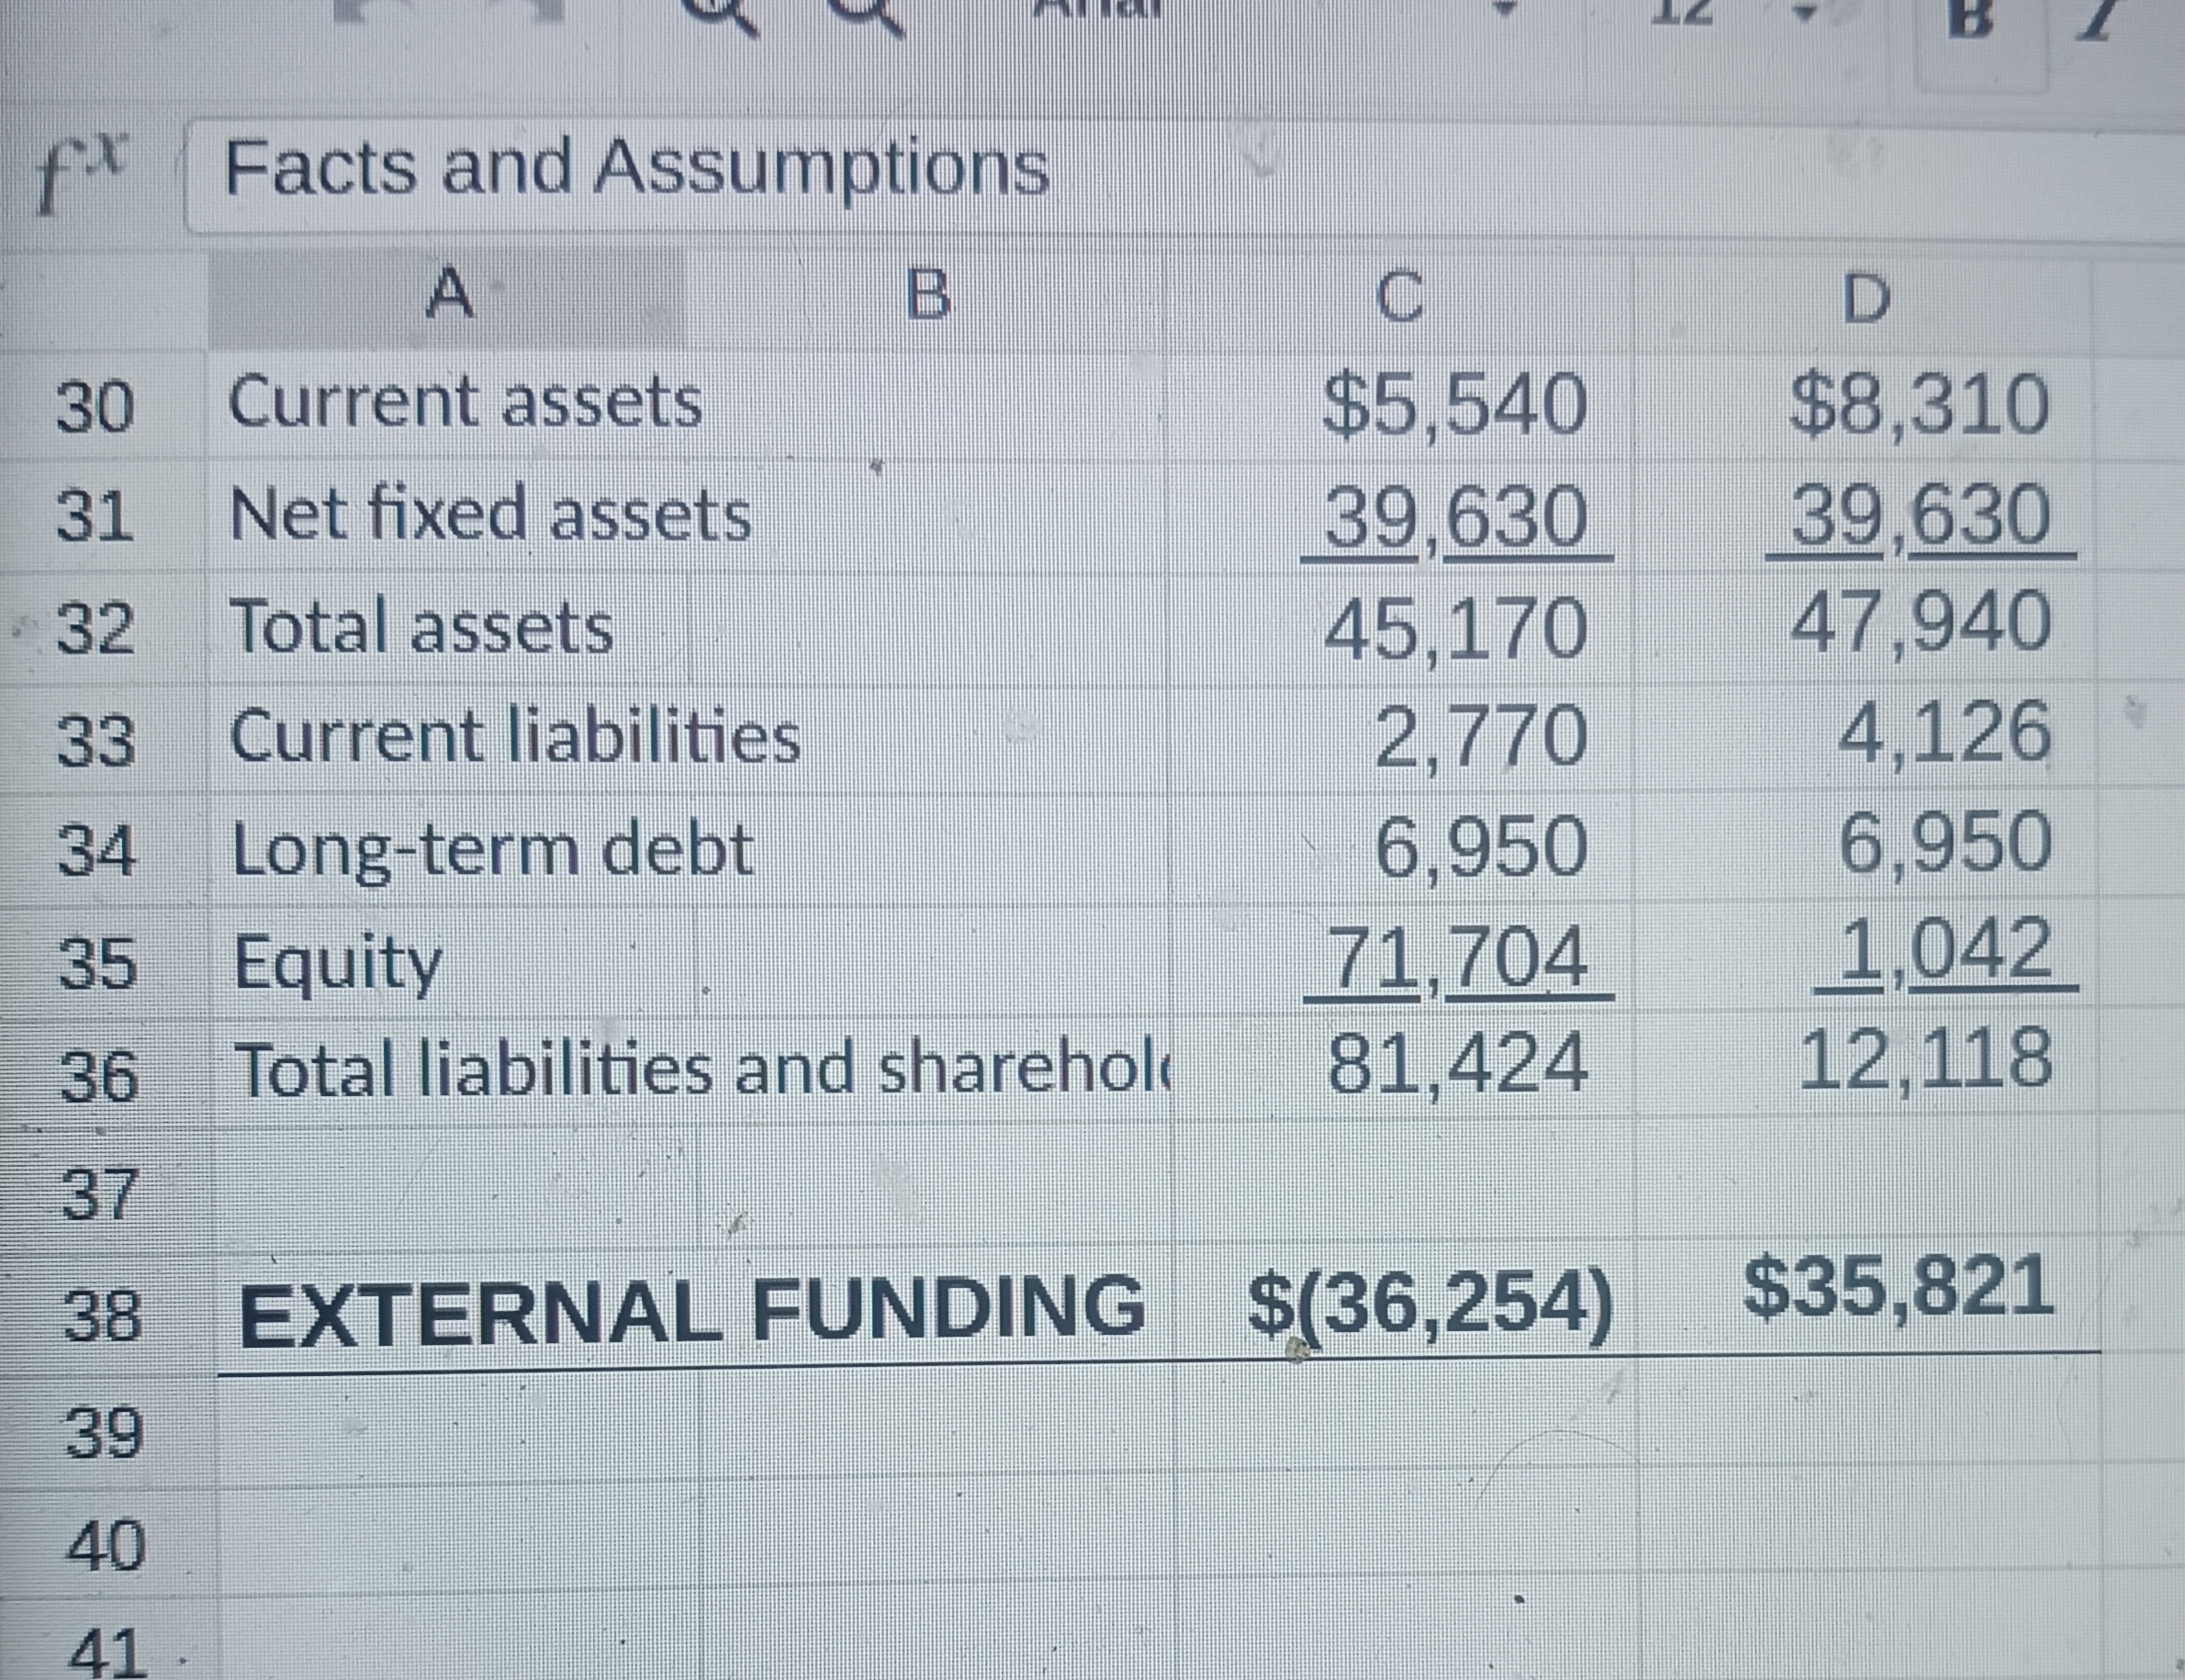 Financial Unit 3.xIsx File Edit Insert Format Help fx Facts and Assumptions A B C D E 1 Facts and Assumptions 2 Year 2015 2016 2017 3 Net sales $14,150 4 Growth rate in sales 5 Cost of goods sold 6 Gen., sell,, and admin. Exper 7 Long-term de 8 Current porti $6,950 9 Interest rate 10 Tax rate 11 Dividend/earnings after tax 12. Current assets 13 Net fixed assi $39,630 $19,103 35% 50% 1 Surrent liahilities \$- 0 86% 12% $6,950 86% \$- 0 $6,950 10% \$- 0 45% 10% 45% 50% 50% 29% 29% $39,630 $39,630 Sheet1 Financial Unit 3.xIsx File Edit Insert Format Help Q Arial 12B B U f fx Facts and Assumptions 17 INCOME STATEMENT 18 Year 19 Net sales 20 Cost of good sold 21 Gross profit 22 Gen., sell,, and admin. exp. 23 Interest expense 24 Earnings before tax 2015 25. Tax 26 Earnings after tax 2016$19,1032017$28,654 27 Dividends paid 2,67416,4284,01224,642 2,2923,152 (313)6953,790(2,930) ((172)141)2,1,0706 (). 1,042 Sheet1 fx Facts and Assumptions fx Facts and Assumptions 37 38 EXTERNAL FUNDING $(36,254)$35,821 39 40 41 Financial Unit 3.xIsx File Edit Insert Format Help fx Facts and Assumptions A B C D E 1 Facts and Assumptions 2 Year 2015 2016 2017 3 Net sales $14,150 4 Growth rate in sales 5 Cost of goods sold 6 Gen., sell,, and admin. Exper 7 Long-term de 8 Current porti $6,950 9 Interest rate 10 Tax rate 11 Dividend/earnings after tax 12. Current assets 13 Net fixed assi $39,630 $19,103 35% 50% 1 Surrent liahilities \$- 0 86% 12% $6,950 86% \$- 0 $6,950 10% \$- 0 45% 10% 45% 50% 50% 29% 29% $39,630 $39,630 Sheet1 Financial Unit 3.xIsx File Edit Insert Format Help Q Arial 12B B U f fx Facts and Assumptions 17 INCOME STATEMENT 18 Year 19 Net sales 20 Cost of good sold 21 Gross profit 22 Gen., sell,, and admin. exp. 23 Interest expense 24 Earnings before tax 2015 25. Tax 26 Earnings after tax 2016$19,1032017$28,654 27 Dividends paid 2,67416,4284,01224,642 2,2923,152 (313)6953,790(2,930) ((172)141)2,1,0706 (). 1,042 Sheet1 fx Facts and Assumptions fx Facts and Assumptions 37 38 EXTERNAL FUNDING $(36,254)$35,821 39 40 41
 Step by Step Solution
There are 3 Steps involved in it
Step: 1

Get Instant Access to Expert-Tailored Solutions
See step-by-step solutions with expert insights and AI powered tools for academic success
Step: 2

Step: 3
Ace Your Homework with AI
Get the answers you need in no time with our AI-driven, step-by-step assistance
Get Started
A Fast And Frugal Finance
Authors: William P. Forbes, Aloysius Igboekwu, Shabnam Mousavi
1st Edition
0128124954, 978-0128124956