

Question
Using the Fastgro Fertilizer Company data again, develop a seasonally adjusted forecast for the demand. Use the linear trend line and the seasonal factors to
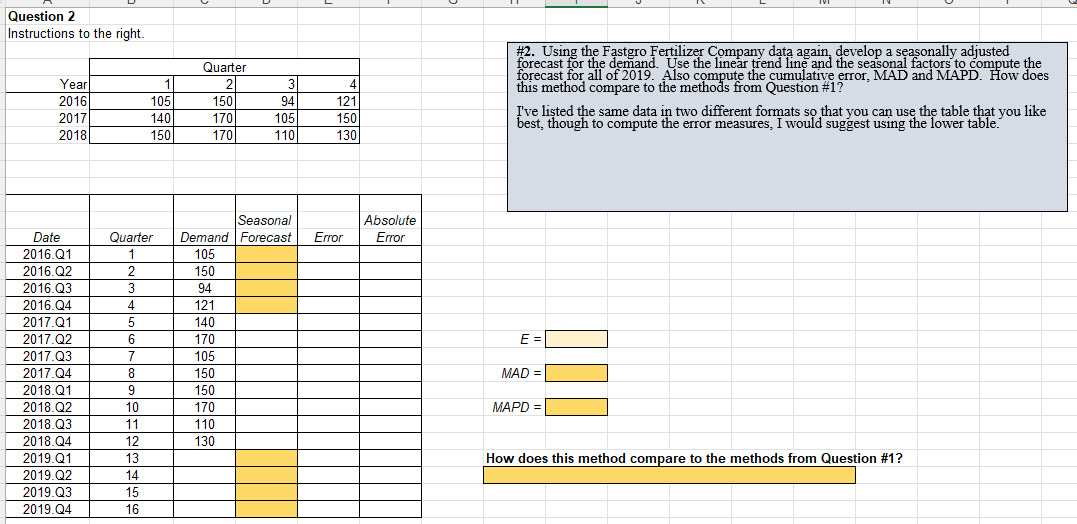
Using the Fastgro Fertilizer Company data again, develop a seasonally adjusted forecast for the demand. Use the linear trend line and the seasonal factors to compute the forecast for all of 2019. Also compute the cumulative error, MAD and MAPD. How does this method compare to the methods from Question #1?
I've listed the same data in two different formats so that you can use the table that you like best, though to compute the error measures, I would suggest using the lower table.
PLEASE USE EXCEL AND SHOW FORUMALS, THANK YOU :)
Step by Step Solution
There are 3 Steps involved in it
Step: 1

Get Instant Access to Expert-Tailored Solutions
See step-by-step solutions with expert insights and AI powered tools for academic success
Step: 2

Step: 3
Ace Your Homework with AI
Get the answers you need in no time with our AI-driven, step-by-step assistance
Get Started
Throughput Modeling Financial Information Used By Decision Makers
Authors: Waymond Rodgers
1st Edition
0762303409, 978-0762303403