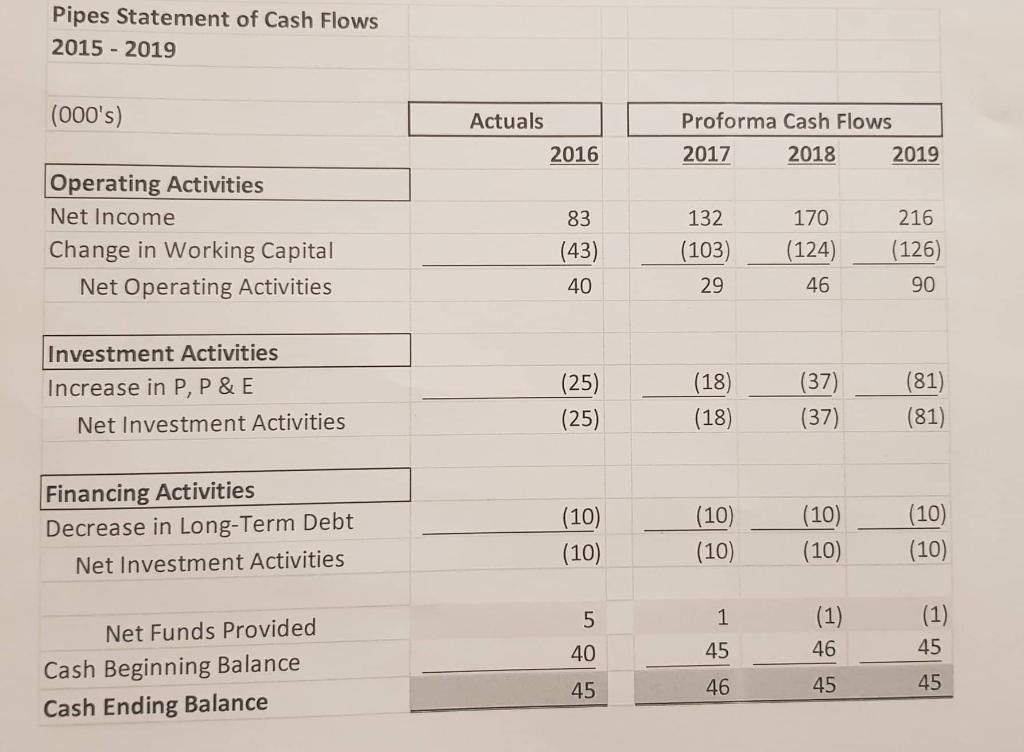
Using the financial information: Proforma Income Statement, Balance Sheet, statement of Cash Flows and Key Ratios. Solve these senrios and how the financial information will change when the following scenario:
a. The Banker of Pipes is only willing to loan the company up to $500K for the years 2017, 2018 and 2019.
No other debt financing is available from any financial institution.
b. You must pull together a set of Proforma statements with the above loan constraints. Additional
constraints:
i. Cash must remain constant at $45K
ii. Prepaid Expenses must remain constant at $28K
iii. Accounts Receivable Days cannot be less than 30 Days
iv. Inventory Days cannot be less than 85 Days
v. Plant, Property and Equipment must grow at least 5% in 2017 and at least 10% in the next two
years
vi. You must keep ROE (return on Equity) at 30% or higher for all proforma years
vii. As indicated above, the Bank loan is frozen at $500K (you cant increase Long-term debt and
must pay back $10K per year as stated in the base plan)
viii. You must meet or beat base proforma income for all 3 years
c. What are the implications of the plan you have pulled together to meet the above constraints Please
explain in detail?
d. Write Summarize your findings from the What if scenario in a one page executive summary.
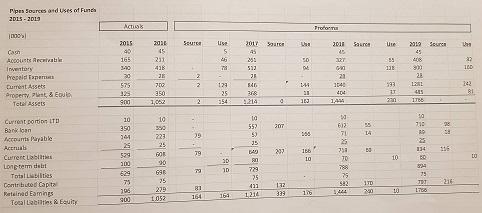
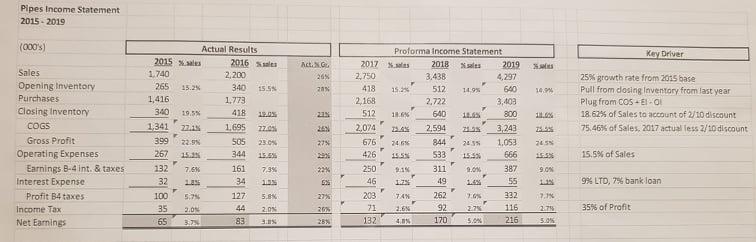
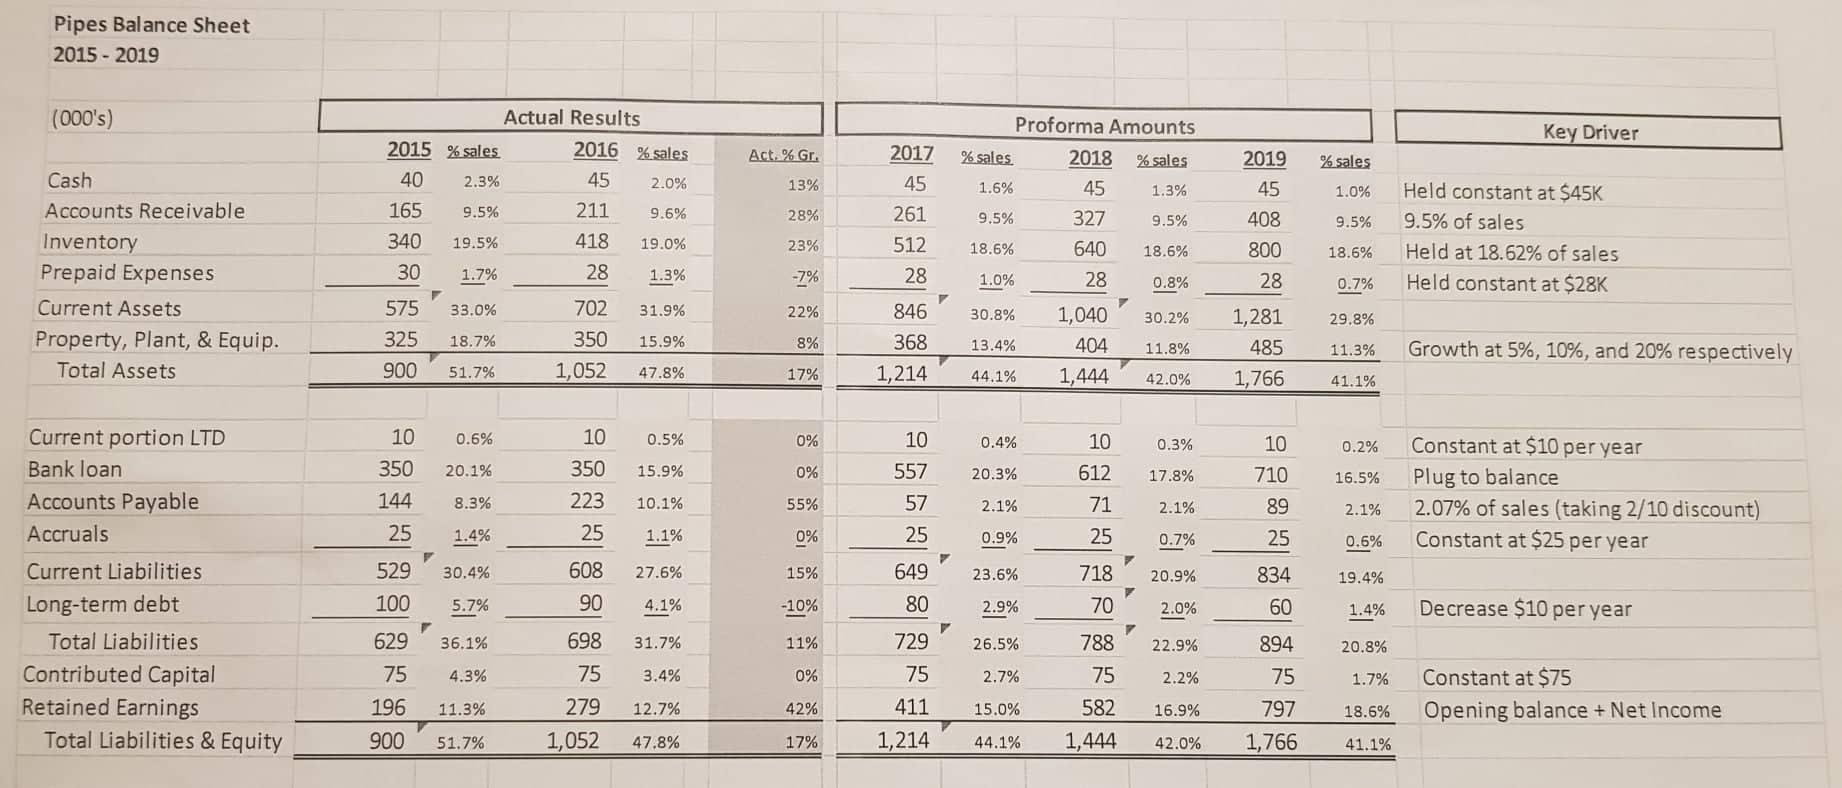
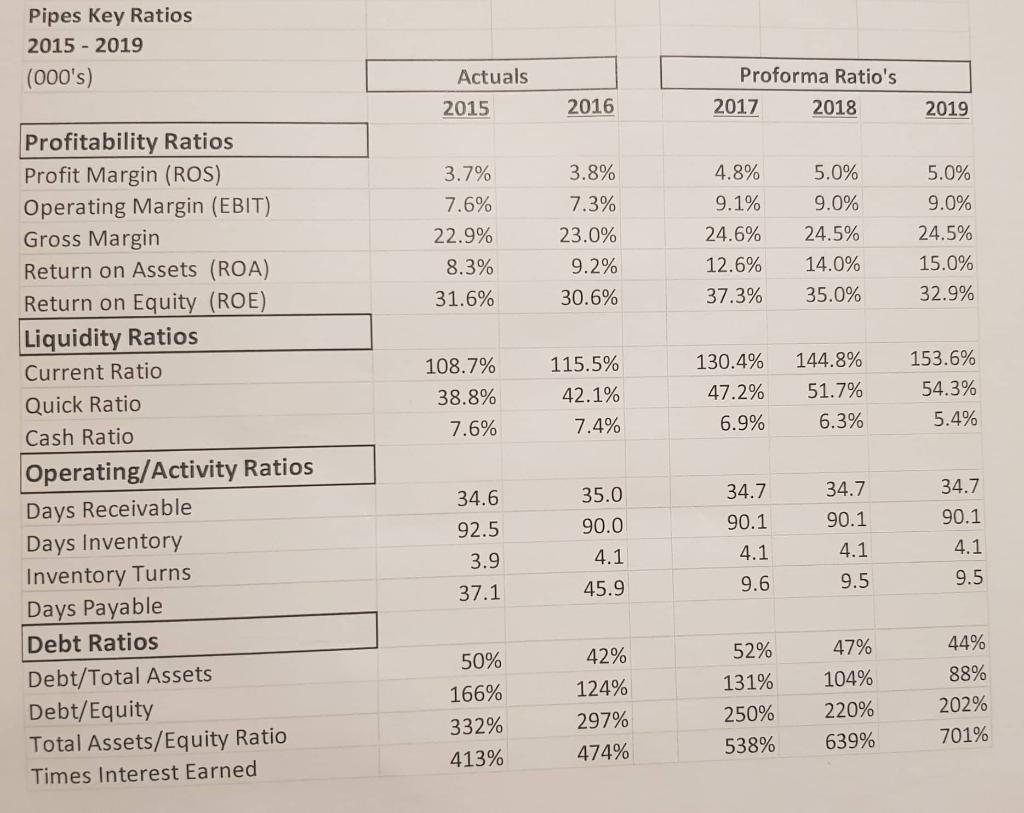
pen Sources and uses of Funds 2015 - 2019 AC Profon 1000 Source Use Bar Source Use Source 2001 45 22 ACORN Areal 45 205 ED BS 13 22 ID a 2015 40 165 320 20 575 325 90 203 45 231 416 JE 7ro 350 1,062 2019 25 406 900 2 128 405 25 2 2 F Prepeld Tapas Current Assets Property & Eve Total Assets 129 25 14 21 13 21 1146 404 1444 193 1 an 242 81 2 5214 a La 557 301 35 14 50 730 RD 23 134 98 38 956 29 & 291 33 79 106 10 350 901 25 579 200 629 75 796 900 10 30 223 25 BOB 90 696 25 279 1.052 Carrot portion ITD Bank loan counts Payable Actual Current Lab Long term det Totalities Contributo Capit Materadamings Tocal Liabilis R Eity 1bb 10 62 TI 23 750 70 788 75 582 10 3D 10 79 729 25 34 75 JE 1760 36 81 164 122 333 170 200 16 10 1214 164 Pipes Income Statement 2015 - 2019 (000) Key Driver 2015 ANG 26% 20 2017 2.750 418 2.168 512 19.9 1.740 265 1,416 340 1,341 399 267 25% growth rate from 2015 base Pull from dosing Inventory from last year Plug from COSE- 18.62% of Sales to account of 2/10 discount 75.46% of Sales, 2017 actuelles 2/todiscount 25 11.0 25 2074 fi S. Sales Opening Inventory Purchases Closing Inventory COGS Gross Profit Operating Expenses Earnings B-4 int. & taxes Interest Expense Profit B4 taxes Income Tax Net Earnings Actual Results 2016 2,200 15.2% 340 15.5 1.773 19.5% 418 12.05 27 1.695 . 22.99 505 23.04 15 344 15.55 7.6% 161 7.95 1256 34 5.29 127 5.03 2.0 44 2.05 3.2 83 3.05 278 Proforma Income Statement 2018 2019 3.438 4,297 15. 512 149% 640 2,722 3,400 11. 640 10.05 800 2.594 3,243 24.6% 844 24 1.053 1555 533 15.53 666 1 311 1.04 387 1.23 49 LEX 55 74 262 9.09 332 3.6 92 22 116 40 170 5.046 216 245 676 426 15:39 15.5% of Sales 132 22% 250 9.09 32 9% LTD,79% bank loan 27% 17.1% 100 35 65 46 203 21 132 35% of Profit 2015 25% 50% Pipes Balance Sheet 2015 - 2019 (000's) Proforma Amounts Key Driver Act. % Gr. % sales 2018 % sales % sales 13% Actual Results 2015 % sales 2016 % sales 40 2.3% 45 2.0% 165 9.5% 211 9.6% 340 19.5% 418 19.0% 30 1.7% 28 1.3% 1.6% 1.3% 1.0% 28% 2017 45 261 512 28 9.5% 9.5% 9.5% 2019 45 408 800 28 45 327 640 28 Cash Accounts Receivable Inventory Prepaid Expenses Current Assets Property, Plant, & Equip. Total Assets Held constant at $45K 9.5% of sales Held at 18.62% of sales Held constant at $28K 23% 18.6% 18.6% 18.6% -7% 1.0% 0.8% 0.7% 575 33.0% 702 31.9% 22% 846 30.8% 30.2% 29.8% 325 18.7% 350 15.9% 8% 368 13.4% 1,040 404 1,444 11.8% 1,281 485 1,766 11.3% Growth at 5%, 10%, and 20% respectively 900 51.7% 1,052 47.8% 17% 1,214 44.1% 42.0% 41.1% 10 0.6% 0.5% 0% 0.4% 10 0.3% 10 0.2% 10 557 20.1% 15.9% 0% 20.3% 612 17.8% 10 350 223 25 350 144 25 16.5% Constant at $10 per year Plug to balance 2.07% of sales (taking 2/10 discount) Constant at $25 per year 8.3% 10.1% 55% 2.1% 71 2.1% 710 89 25 57 25 2.1% 1.4% 1.1% 0% 0.9% 25 0.7% 0.6% 529 30.4% 608 27.6% 15% 649 23.6% 20.9% 19.4% Current portion LTD Bank loan Accounts Payable Accruals Current Liabilities Long-term debt Total Liabilities Contributed Capital Retained Earnings Total Liabilities & Equity 718 70 834 60 100 5.7% 90 4.1% -10% 80 2.9% 2.0% 1.4% Decrease $10 per year 629 36.1% 698 31.7% 11% 26.5% 788 22.9% 20.8% 729 75 75 4.3% 75 3.4% 0% 2.7% 75 2.2% 1.7% 894 75 797 1,766 Constant at $75 Opening balance + Net Income 196 11.3% 279 12.7% 42% 411 15.0% 16.9% 18.6% 582 1,444 900 51.7% 1,052 47.8% 17% 1,214 44.1% 42.0% 41.1% Pipes Key Ratios 2015 - 2019 (000's) Actuals Proforma Ratio's 2015 2016 2017 2018 2019 3.7% 7.6% 22.9% 8.3% 31.6% 3.8% 7.3% 23.0% 9.2% 30.6% 4.8% 9.1% 24.6% 12.6% 37.3% 5.0% 9.0% 24.5% 14.0% 35.0% 5.0% 9.0% 24.5% 15.0% 32.9% 108.7% 38.8% 7.6% 115.5% 42.1% 7.4% 130.4% 47.2% 6.9% 144.8% 51.7% 6.3% 153.6% 54.3% 5.4% Profitability Ratios Profit Margin (ROS) Operating Margin (EBIT) Gross Margin Return on Assets (ROA) Return on Equity (ROE) Liquidity Ratios Current Ratio Quick Ratio Cash Ratio Operating/Activity Ratios Days Receivable Days Inventory Inventory Turns Days Payable Debt Ratios Debt/Total Assets Debt/Equity Total Assets/Equity Ratio Times Interest Earned 34.7 35.0 90.0 34.7 90.1 34.6 92.5 3.9 37.1 34.7 90.1 4.1 9.5 4.1 45.9 90.1 4.1 9.5 4.1 9.6 50% 166% 332% 413% 42% 124% 297% 474% 52% 131% 250% 538% 47% 104% 220% 639% 44% 88% 202% 701% Pipes Statement of Cash Flows 2015 - 2019 (000's) Actuals 2016 Proforma Cash Flows 2017 2018 2019 Operating Activities Net Income Change in Working Capital Net Operating Activities 83 (43) 40 132 (103) 29 170 (124) 46 216 (126) 90 Investment Activities Increase in P, P & E Net Investment Activities (18) (81) (25) (25) (37) (37) (18) (81) (10) Financing Activities Decrease in Long-Term Debt Net Investment Activities (10) (10) (10) (10) (10) (10) (10) 1 5 40 (1) 46 (1) 45 45 Net Funds Provided Cash Beginning Balance Cash Ending Balance 45 46 45 45 pen Sources and uses of Funds 2015 - 2019 AC Profon 1000 Source Use Bar Source Use Source 2001 45 22 ACORN Areal 45 205 ED BS 13 22 ID a 2015 40 165 320 20 575 325 90 203 45 231 416 JE 7ro 350 1,062 2019 25 406 900 2 128 405 25 2 2 F Prepeld Tapas Current Assets Property & Eve Total Assets 129 25 14 21 13 21 1146 404 1444 193 1 an 242 81 2 5214 a La 557 301 35 14 50 730 RD 23 134 98 38 956 29 & 291 33 79 106 10 350 901 25 579 200 629 75 796 900 10 30 223 25 BOB 90 696 25 279 1.052 Carrot portion ITD Bank loan counts Payable Actual Current Lab Long term det Totalities Contributo Capit Materadamings Tocal Liabilis R Eity 1bb 10 62 TI 23 750 70 788 75 582 10 3D 10 79 729 25 34 75 JE 1760 36 81 164 122 333 170 200 16 10 1214 164 Pipes Income Statement 2015 - 2019 (000) Key Driver 2015 ANG 26% 20 2017 2.750 418 2.168 512 19.9 1.740 265 1,416 340 1,341 399 267 25% growth rate from 2015 base Pull from dosing Inventory from last year Plug from COSE- 18.62% of Sales to account of 2/10 discount 75.46% of Sales, 2017 actuelles 2/todiscount 25 11.0 25 2074 fi S. Sales Opening Inventory Purchases Closing Inventory COGS Gross Profit Operating Expenses Earnings B-4 int. & taxes Interest Expense Profit B4 taxes Income Tax Net Earnings Actual Results 2016 2,200 15.2% 340 15.5 1.773 19.5% 418 12.05 27 1.695 . 22.99 505 23.04 15 344 15.55 7.6% 161 7.95 1256 34 5.29 127 5.03 2.0 44 2.05 3.2 83 3.05 278 Proforma Income Statement 2018 2019 3.438 4,297 15. 512 149% 640 2,722 3,400 11. 640 10.05 800 2.594 3,243 24.6% 844 24 1.053 1555 533 15.53 666 1 311 1.04 387 1.23 49 LEX 55 74 262 9.09 332 3.6 92 22 116 40 170 5.046 216 245 676 426 15:39 15.5% of Sales 132 22% 250 9.09 32 9% LTD,79% bank loan 27% 17.1% 100 35 65 46 203 21 132 35% of Profit 2015 25% 50% Pipes Balance Sheet 2015 - 2019 (000's) Proforma Amounts Key Driver Act. % Gr. % sales 2018 % sales % sales 13% Actual Results 2015 % sales 2016 % sales 40 2.3% 45 2.0% 165 9.5% 211 9.6% 340 19.5% 418 19.0% 30 1.7% 28 1.3% 1.6% 1.3% 1.0% 28% 2017 45 261 512 28 9.5% 9.5% 9.5% 2019 45 408 800 28 45 327 640 28 Cash Accounts Receivable Inventory Prepaid Expenses Current Assets Property, Plant, & Equip. Total Assets Held constant at $45K 9.5% of sales Held at 18.62% of sales Held constant at $28K 23% 18.6% 18.6% 18.6% -7% 1.0% 0.8% 0.7% 575 33.0% 702 31.9% 22% 846 30.8% 30.2% 29.8% 325 18.7% 350 15.9% 8% 368 13.4% 1,040 404 1,444 11.8% 1,281 485 1,766 11.3% Growth at 5%, 10%, and 20% respectively 900 51.7% 1,052 47.8% 17% 1,214 44.1% 42.0% 41.1% 10 0.6% 0.5% 0% 0.4% 10 0.3% 10 0.2% 10 557 20.1% 15.9% 0% 20.3% 612 17.8% 10 350 223 25 350 144 25 16.5% Constant at $10 per year Plug to balance 2.07% of sales (taking 2/10 discount) Constant at $25 per year 8.3% 10.1% 55% 2.1% 71 2.1% 710 89 25 57 25 2.1% 1.4% 1.1% 0% 0.9% 25 0.7% 0.6% 529 30.4% 608 27.6% 15% 649 23.6% 20.9% 19.4% Current portion LTD Bank loan Accounts Payable Accruals Current Liabilities Long-term debt Total Liabilities Contributed Capital Retained Earnings Total Liabilities & Equity 718 70 834 60 100 5.7% 90 4.1% -10% 80 2.9% 2.0% 1.4% Decrease $10 per year 629 36.1% 698 31.7% 11% 26.5% 788 22.9% 20.8% 729 75 75 4.3% 75 3.4% 0% 2.7% 75 2.2% 1.7% 894 75 797 1,766 Constant at $75 Opening balance + Net Income 196 11.3% 279 12.7% 42% 411 15.0% 16.9% 18.6% 582 1,444 900 51.7% 1,052 47.8% 17% 1,214 44.1% 42.0% 41.1% Pipes Key Ratios 2015 - 2019 (000's) Actuals Proforma Ratio's 2015 2016 2017 2018 2019 3.7% 7.6% 22.9% 8.3% 31.6% 3.8% 7.3% 23.0% 9.2% 30.6% 4.8% 9.1% 24.6% 12.6% 37.3% 5.0% 9.0% 24.5% 14.0% 35.0% 5.0% 9.0% 24.5% 15.0% 32.9% 108.7% 38.8% 7.6% 115.5% 42.1% 7.4% 130.4% 47.2% 6.9% 144.8% 51.7% 6.3% 153.6% 54.3% 5.4% Profitability Ratios Profit Margin (ROS) Operating Margin (EBIT) Gross Margin Return on Assets (ROA) Return on Equity (ROE) Liquidity Ratios Current Ratio Quick Ratio Cash Ratio Operating/Activity Ratios Days Receivable Days Inventory Inventory Turns Days Payable Debt Ratios Debt/Total Assets Debt/Equity Total Assets/Equity Ratio Times Interest Earned 34.7 35.0 90.0 34.7 90.1 34.6 92.5 3.9 37.1 34.7 90.1 4.1 9.5 4.1 45.9 90.1 4.1 9.5 4.1 9.6 50% 166% 332% 413% 42% 124% 297% 474% 52% 131% 250% 538% 47% 104% 220% 639% 44% 88% 202% 701% Pipes Statement of Cash Flows 2015 - 2019 (000's) Actuals 2016 Proforma Cash Flows 2017 2018 2019 Operating Activities Net Income Change in Working Capital Net Operating Activities 83 (43) 40 132 (103) 29 170 (124) 46 216 (126) 90 Investment Activities Increase in P, P & E Net Investment Activities (18) (81) (25) (25) (37) (37) (18) (81) (10) Financing Activities Decrease in Long-Term Debt Net Investment Activities (10) (10) (10) (10) (10) (10) (10) 1 5 40 (1) 46 (1) 45 45 Net Funds Provided Cash Beginning Balance Cash Ending Balance 45 46 45 45