Answered step by step
Verified Expert Solution
Question
1 Approved Answer
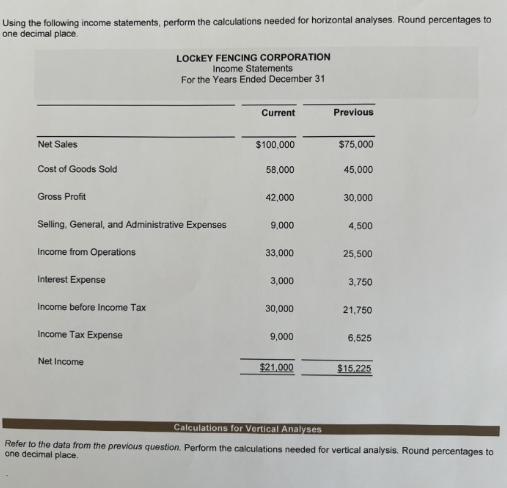
Using the following income statements, perform the calculations needed for horizontal analyses. Round percentages to one decimal place. LOCKEY FENCING CORPORATION Income Statements For


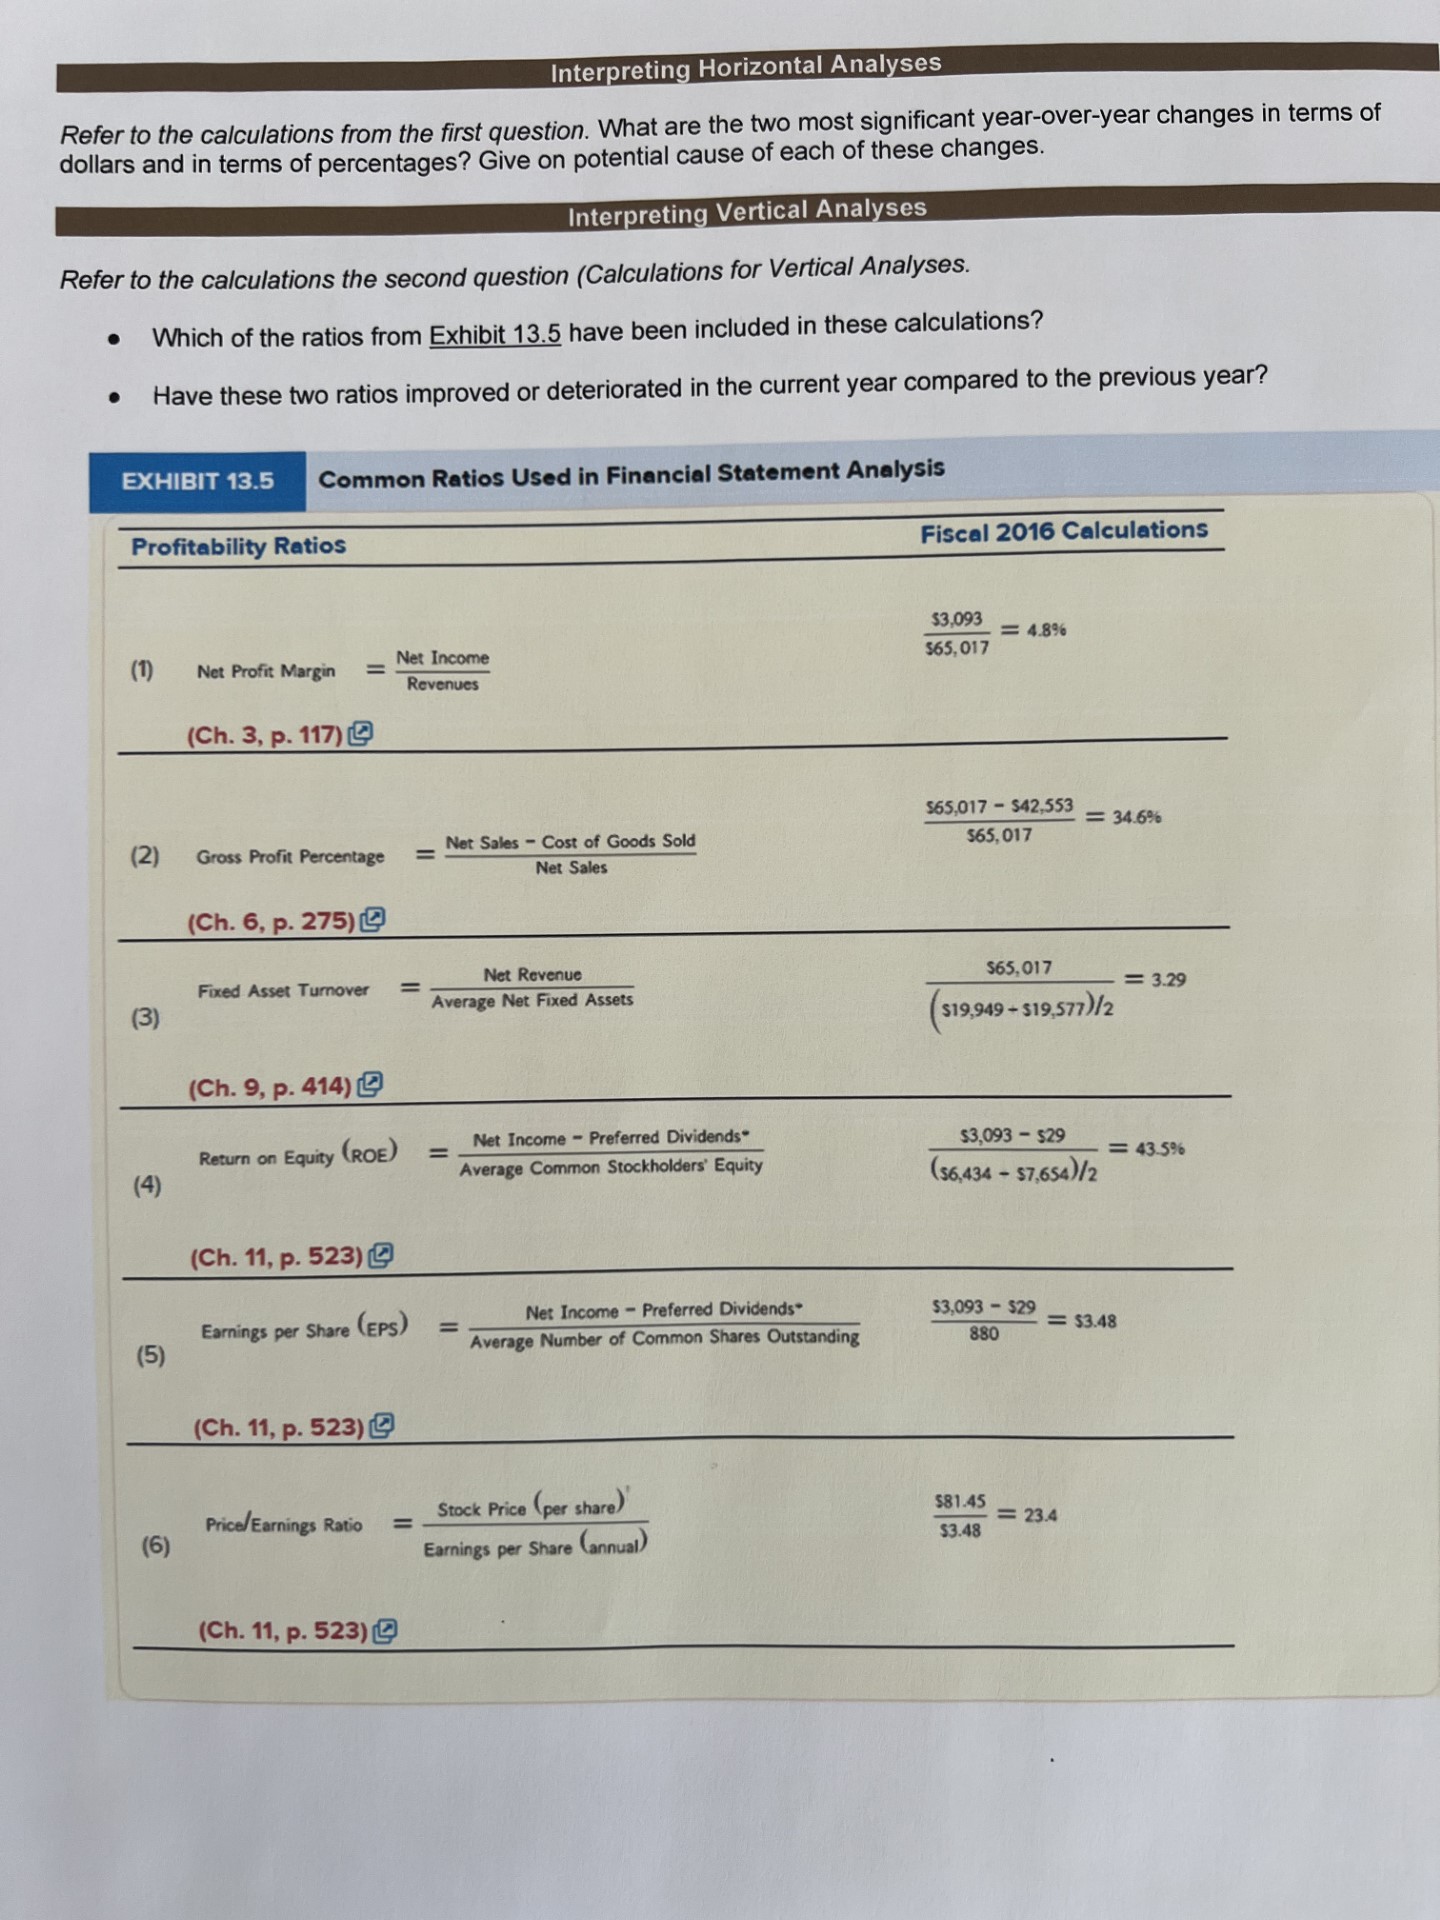
Using the following income statements, perform the calculations needed for horizontal analyses. Round percentages to one decimal place. LOCKEY FENCING CORPORATION Income Statements For the Years Ended December 31 Current Previous Net Sales $100,000 $75,000 Cost of Goods Sold 58,000 45,000 Gross Profit 42,000 30,000 Selling, General, and Administrative Expenses 9,000 4,500 Income from Operations 33,000 25,500 Interest Expense 3,000 3,750 Income before Income Tax 30,000 21,750 Income Tax Expense 9,000 6,525 Net Income $21,000 $15.225 Calculations for Vertical Analyses Refer to the data from the previous question. Perform the calculations needed for vertical analysis. Round percentages to one decimal place. Interpreting Horizontal Analyses Refer to the calculations from the first question. What are the two most significant year-over-year changes in terms of dollars and in terms of percentages? Give on potential cause of each of these changes. Interpreting Vertical Analyses Refer to the calculations the second question (Calculations for Vertical Analyses. Which of the ratios from Exhibit 13.5 have been included in these calculations? Have these two ratios improved or deteriorated in the current year compared to the previous year? EXHIBIT 13.5 Common Ratios Used in Financial Statement Analysis Profitability Ratios Fiscal 2016 Calculations (1) Net Profit Margin = Net Income Revenues (Ch. 3, p. 117) $3,093 $65,017 = 4.8% $65,017 $42.553 = 34.6% (2) Gross Profit Percentage = Net Sales Cost of Goods Sold Net Sales $65,017 (Ch. 6, p. 275) Fixed Asset Turnover = (3) Net Revenue Average Net Fixed Assets (Ch. 9, p. 414) Return on Equity (ROE) = (4) Net Income-Preferred Dividends Average Common Stockholders' Equity (Ch. 11, p. 523) Earnings per Share (EPS) = (5) Net Income Preferred Dividends Average Number of Common Shares Outstanding (Ch. 11, p. 523) $65,017 $19,949 - $19,577)/2 =3.29 $3,093-$29 ($6,434 - $7,654)/2 = 43.5% $3,093-$29 880 = $3.48 Price/Earnings Ratio == Stock Price (per share) $81.45 =23.4 (6) Earnings per Share (annual) $3.48 (Ch. 11, p. 523)
Step by Step Solution
There are 3 Steps involved in it
Step: 1

Get Instant Access to Expert-Tailored Solutions
See step-by-step solutions with expert insights and AI powered tools for academic success
Step: 2

Step: 3

Ace Your Homework with AI
Get the answers you need in no time with our AI-driven, step-by-step assistance
Get Started


