

Answered step by step
Verified Expert Solution
Question
1 Approved Answer
Using the Galley Servicing Delay data and the Excel OM plugin, create a statistical process control chart ( SPC ) ( use the c -
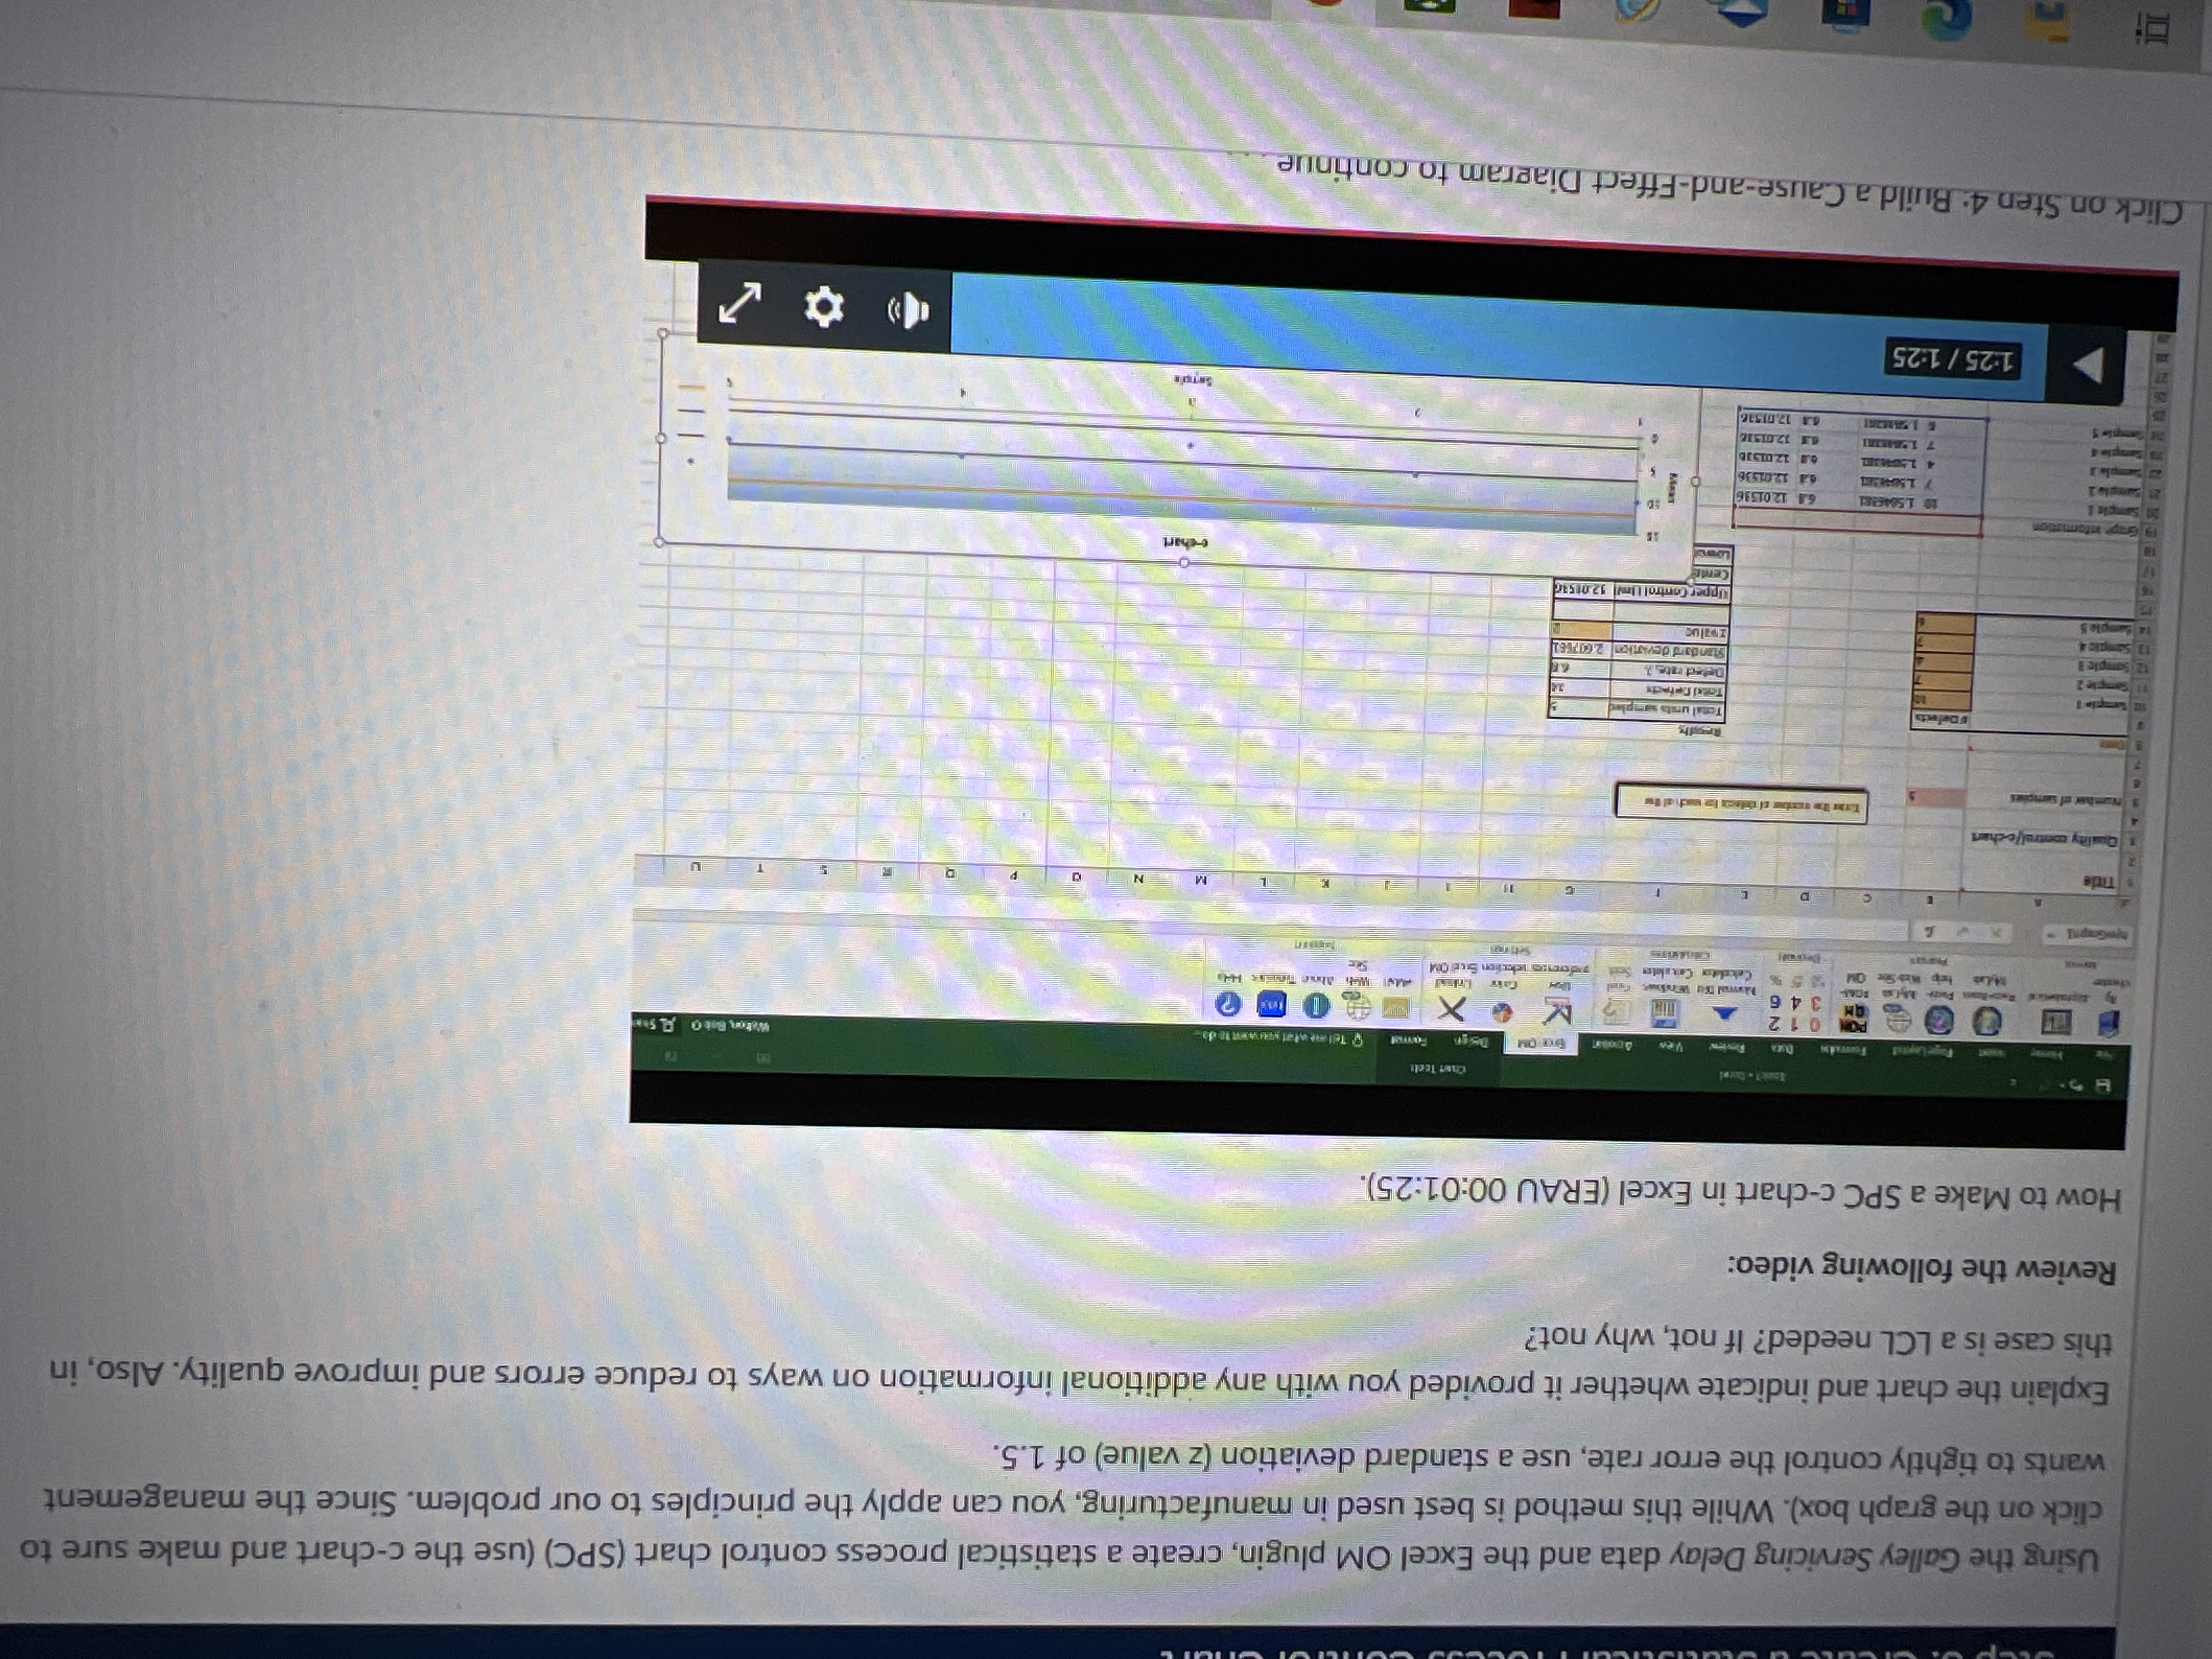
Using the Galley Servicing Delay data and the Excel OM plugin, create a statistical process control chart SPCuse the cchart and make sure to
click on the graph box While this method is best used in manufacturing, you can apply the principles to our problem. Since the management
wants to tightly control the error rate, use a standard deviation value of
Explain the chart and indicate whether it provided you with any additional information on ways to reduce errors and improve quality. Also, in
this case is a LCL needed? If not, why not?
Review the following video:
How to Make a SPC cchart in Excel ERAU ::
Click on Sten : Build a CauseandFffect Diagram to continue..
Step by Step Solution
There are 3 Steps involved in it
Step: 1

Get Instant Access to Expert-Tailored Solutions
See step-by-step solutions with expert insights and AI powered tools for academic success
Step: 2

Step: 3
Ace Your Homework with AI
Get the answers you need in no time with our AI-driven, step-by-step assistance
Get Started
Operations Management
Authors: R. Dan Reid, Nada R. Sanders
4th edition
9780470556702, 470325046, 470556706, 978-0470325049