

Question
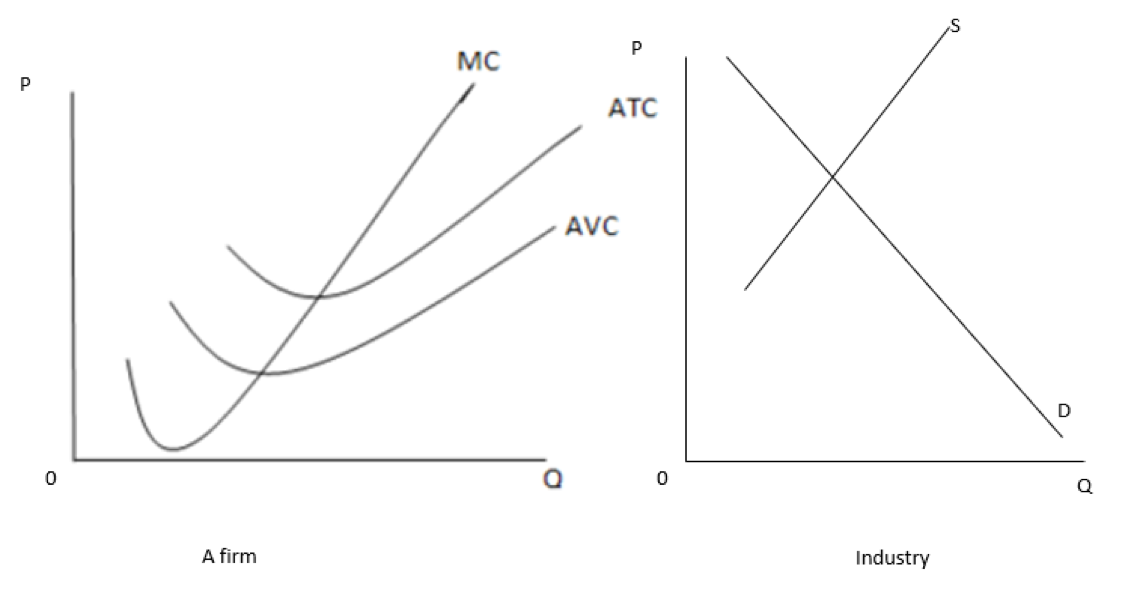
Using the graph below, indicate the following 1)Find the market equilibrium P0 and equilibrium quantity Q0 Draw price=demand=MR=AR curve on the firm in the pure
Using the graph below, indicate the following
1)Find the market equilibrium P0 and equilibrium quantity Q0
Draw price=demand=MR=AR curve on the firm in the pure competitive industry.
2)Fine the quantity level that this firm will produce and mark as q*
3)Shade an area to indicate Total Revenue (mark as TR)
4)Shade an area to indicate Total Cost (mark as TC)
5)Shade an area to indicate Profit/Break-even/Loss.(only one of them) and mark which one of the three.
Step by Step Solution
There are 3 Steps involved in it
Step: 1

Get Instant Access to Expert-Tailored Solutions
See step-by-step solutions with expert insights and AI powered tools for academic success
Step: 2

Step: 3
Ace Your Homework with AI
Get the answers you need in no time with our AI-driven, step-by-step assistance
Get Started
Macroeconomics Principles Applications And Tools
Authors: Arthur O Sullivan, Steven M. Sheffrin, Stephen J. Perez
7th Edition
978-0134089034, 9780134062754, 134089030, 134062752, 978-0132555234