Question
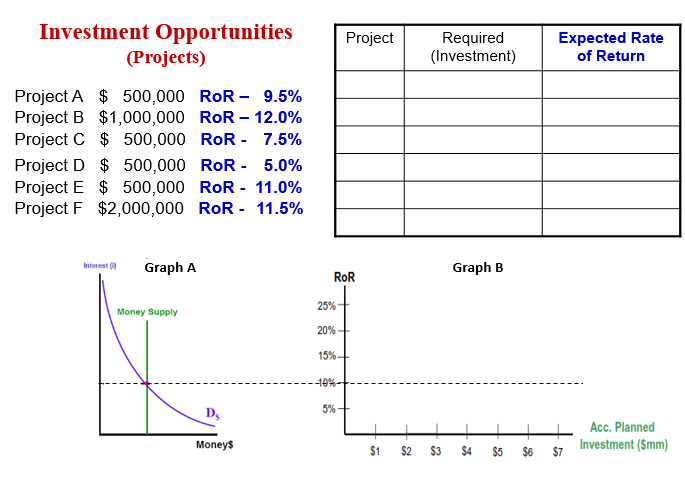
Using the information, matrix and graphs provided A) List projects A - F according the their order importance/priority as established by their respective 'Rates of
Using the information, matrix and graphs provided
A) List projects A - F according the their order importance/priority as established by their respective 'Rates of Returns' (ROR) (Highest ? Lowest; Top ? Bottom).
B) Graphically demonstrate the 'Marginal Efficiency of Capital' (MEC) for this firm and this list of projects.
C) Given a level of Money Supply MS and the Demand for Money (D$) (shown in "Graph A"), graphically demonstrate/determine the likely level of Investment (I) that would be pursued.
D) Using "Graphs A & B", graphically demonstrate/determine what would happen to the level of investment if the Federal Reserve Bank were to implement policies that ultimately raised the market interest rate by 3%.
:

Step by Step Solution
There are 3 Steps involved in it
Step: 1

Get Instant Access to Expert-Tailored Solutions
See step-by-step solutions with expert insights and AI powered tools for academic success
Step: 2

Step: 3

Ace Your Homework with AI
Get the answers you need in no time with our AI-driven, step-by-step assistance
Get Started


