

Answered step by step
Verified Expert Solution
Question
1 Approved Answer
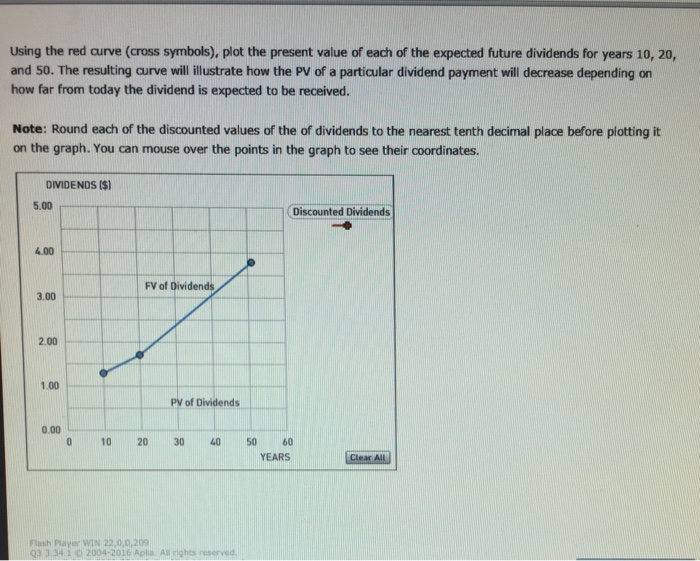
Using the red curve (cross symbols), plot the present value of each of the expected future dividends for years 10, 20, and 50. The resulting
Step by Step Solution
There are 3 Steps involved in it
Step: 1

Get Instant Access to Expert-Tailored Solutions
See step-by-step solutions with expert insights and AI powered tools for academic success
Step: 2

Step: 3
Ace Your Homework with AI
Get the answers you need in no time with our AI-driven, step-by-step assistance
Get Started
Airline Management Finance
Authors: Victor Hughes
1st Edition
1138610690, 978-1138610699