

Question
Using this code in Matlab: clear all; close all; % clear workspace %% Dataset is created N=200; % number of data points x1=10*randn(N,1); % first
Using this code in Matlab:
clear all; close all; % clear workspace
%% Dataset is created
N=200; % number of data points
x1=10*randn(N,1); % first coordinates
x2=4+x1+10*randn(N,1); % second coordinates - example in space of dimension D=2
%% pca
X=[(x1-mean(x1))';(x2-mean(x2))'];
S=(X*X'/N);
[U,L,V] = svd(S);
%% plot data
figure;plot(x1,x2,'kx','LineWidth',2,'MarkerFaceColor','k'),...,
hold on, plot(mean(x1),mean(x2),'ro','LineWidth',2,'MarkerFaceColor','r'), hold on,...
quiver(mean(x1),mean(x2),V(1,1),V(2,1),sqrt(L(1,1)),'g','LineWidth',2), hold on, ...
quiver(mean(x1),@mean(x2),V(1,2),V(2,2),sqrt(L(2,2)),'b','LineWidth',2),hold off, axis equal
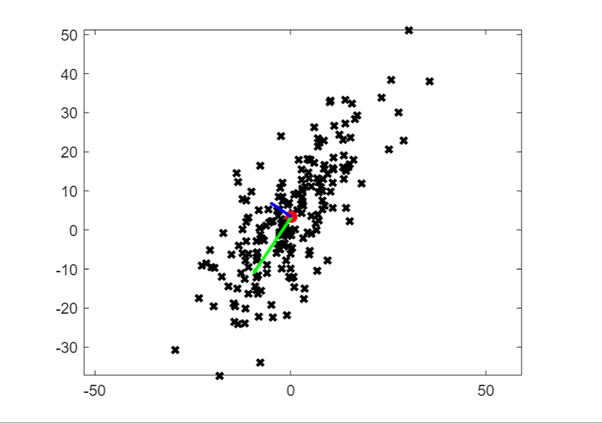
Graph:
Consider u1 and u2 eigenvectors of matrix S wih respective eigenvalues 1 and 2 with 1 > 2. Defining u3 = u1 + u2, is u3 an eigenvector of S? Explain.
Step by Step Solution
There are 3 Steps involved in it
Step: 1

Get Instant Access to Expert-Tailored Solutions
See step-by-step solutions with expert insights and AI powered tools for academic success
Step: 2

Step: 3
Ace Your Homework with AI
Get the answers you need in no time with our AI-driven, step-by-step assistance
Get Started
Oracle 10g Database Administrator Implementation And Administration
Authors: Gavin Powell, Carol McCullough Dieter
2nd Edition
1418836656, 9781418836658