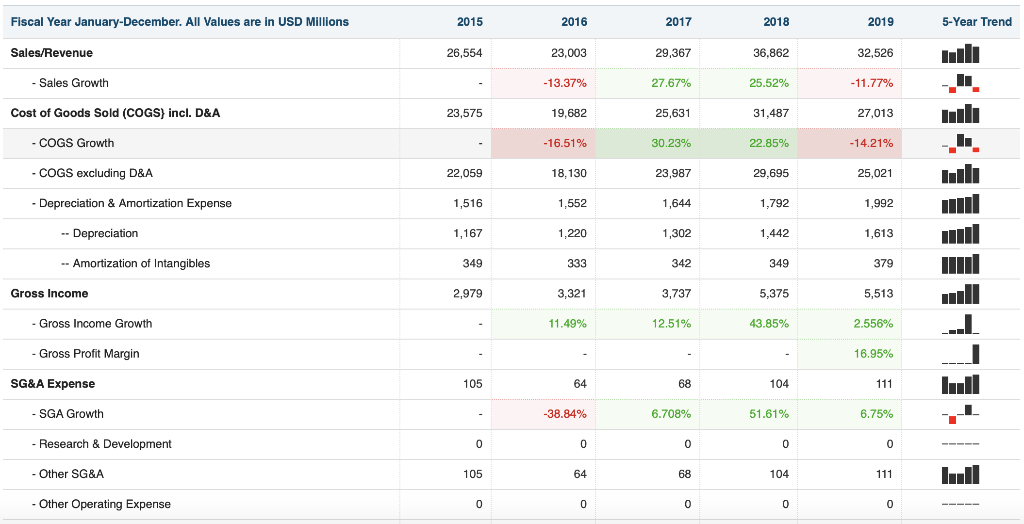
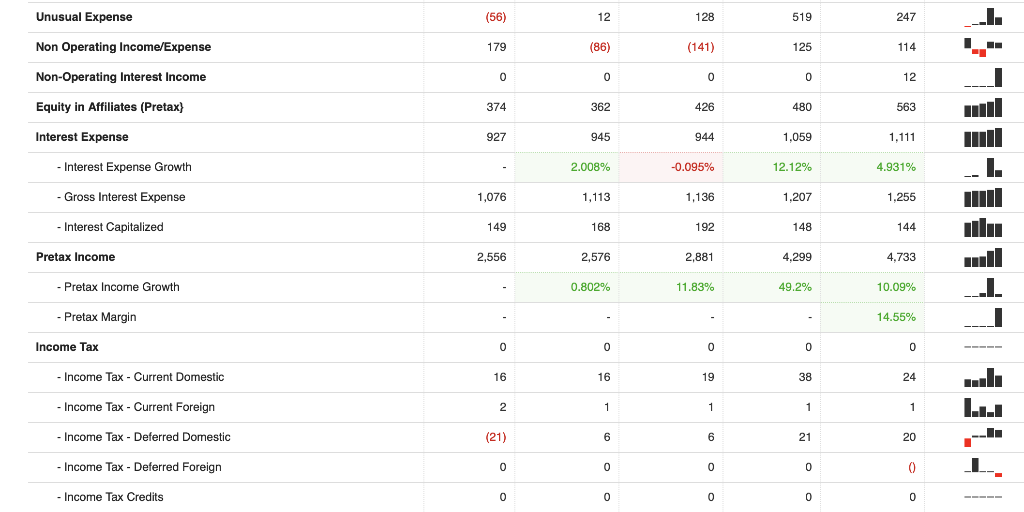
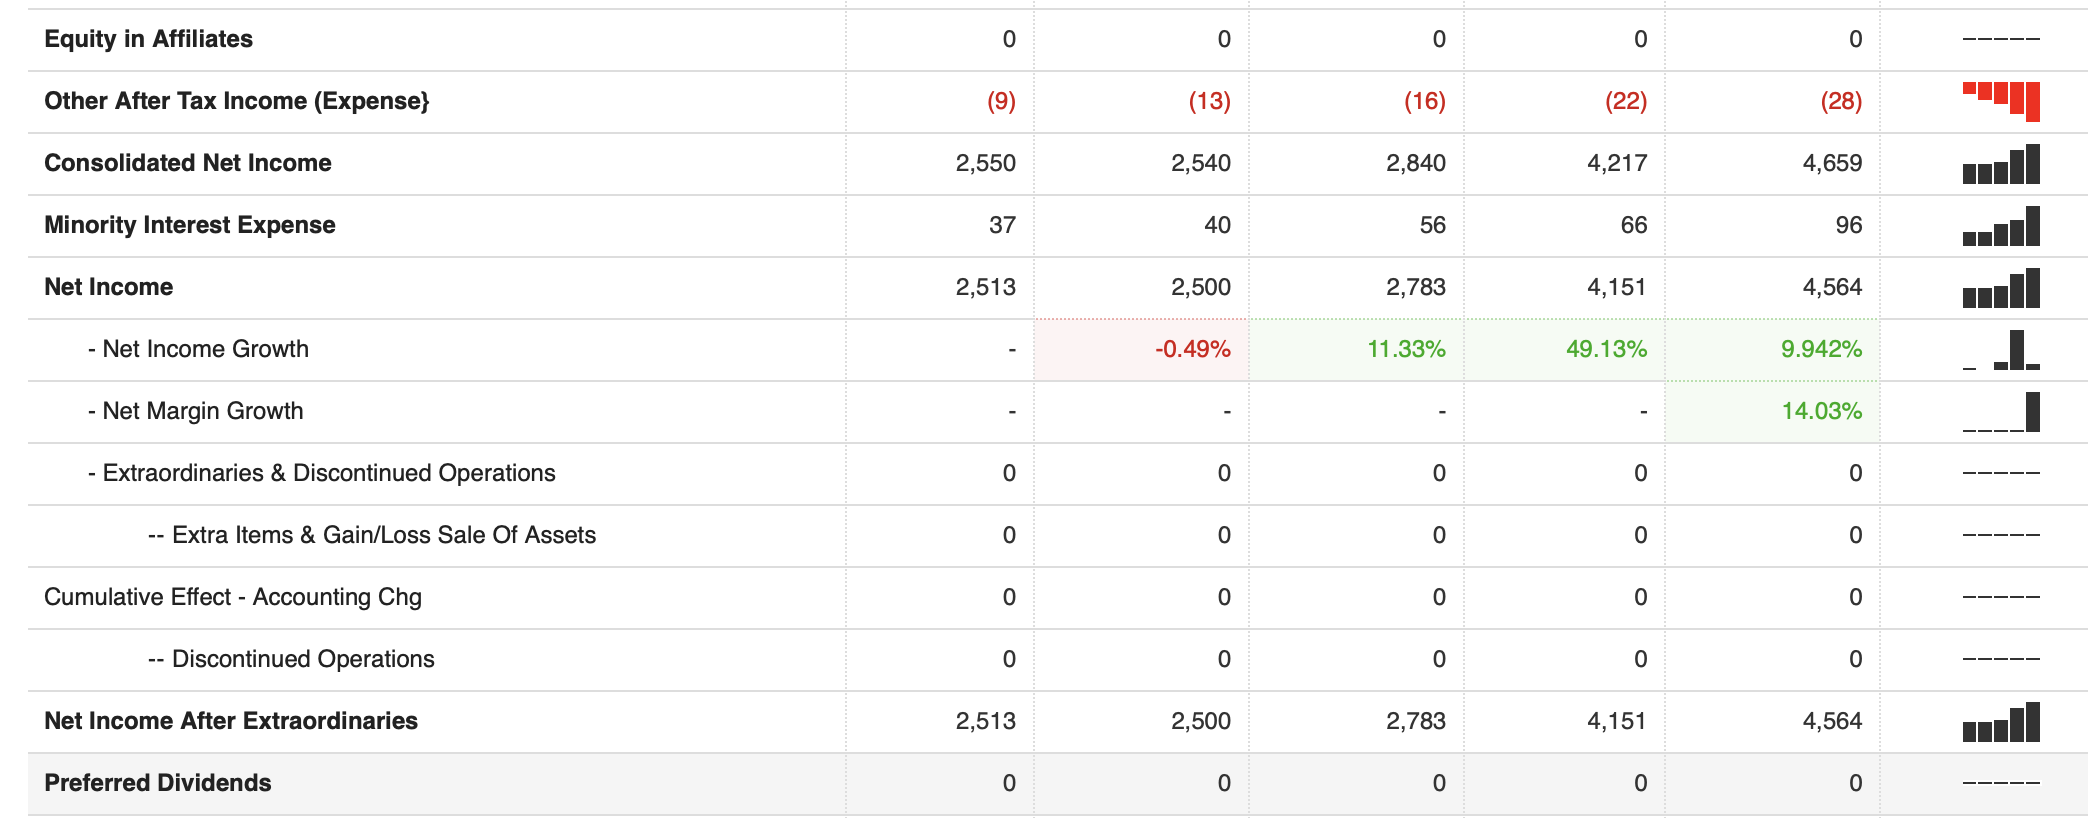
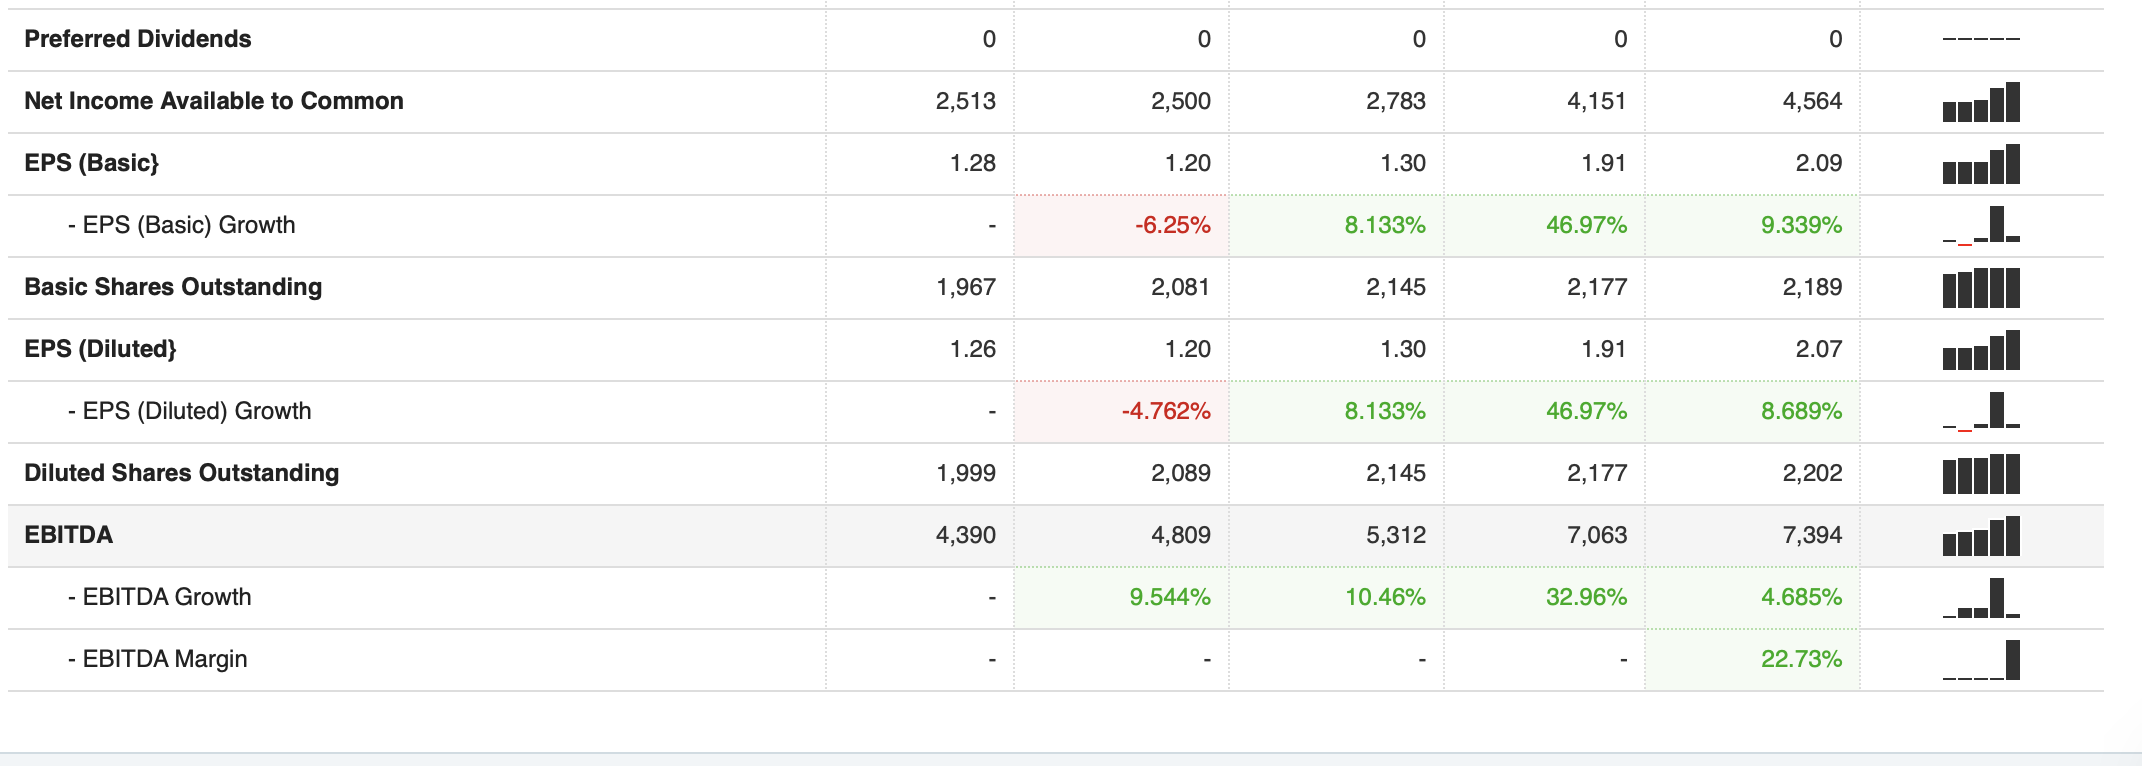
Using this data find and calculate economic parameters of interest for a period of 10 years (2020 as year 0): corporate structure, primary business, revenues, CAPEX, OPEX, BTCF, ATCF, NPV, IRR, PVR, BCR, payback time, ROI) and sensitive/uncertainty analysis.


Fiscal Year January-December. All Values are in USD Millions 2015 2016 2017 2018 2019 5-Year Trend Sales/Revenue 26,554 23,003 29,367 36.862 32,526 - Sales Growth -13.37% 27.67% 25.52% -11.77% Cost of Goods Sold (COGS) incl. D&A 23,575 19,682 25,631 31,487 27,013 - COGS Growth -16.51% 30.23% 22.85% -14.21% - COGS excluding D&A 22,059 18,130 23,987 29,695 25,021 - Depreciation & Amortization Expense 1,516 1,552 1,644 1,792 1,992 -- Depreciation 1,167 1,220 1,302 1,442 1,613 -- Amortization of Intangibles 349 333 342 349 379 Gross Income 2,979 3,321 3,737 5,375 5,513 - Gross Income Growth 11.49% 12.51% 43.85% 2.556% - Gross Profit Margin 16.95% SG&A Expense 104 111 6.75% - SGA Growth -38.84% 6.708% 51.61% - Research & Development - Other SG&A 105 104 111 L - Other Operating Expense Unusual Expense 128 (56) 179 Non Operating Income/Expense (86) (141) Non-Operating Interest Income 0 0 Equity in Affiliates (Pretax} 374 362 426 480 563 Interest Expense 927 945 944 1,059 1,111 - Interest Expense Growth 2.008% -0.095% 12.12% 4.931% -L - Gross Interest Expense 1,076 1,113 1,136 1,207 1,255 - Interest Capitalized 149 168 192 148 144 Pretax Income 2,556 2,576 2,881 4.299 4,733 - Pretax Income Growth 0.802% 11.83% 49.2% 10.09% - Pretax Margin 14.55% TINT-71139-1 Income Tax 0 - Income Tax - Current Domestic - Income Tax - Current Foreign LI - Income Tax - Deferred Domestic - Income Tax - Deferred Foreign - Income Tax Credits 00 Equity in Affiliates 0 0 0 0 Other After Tax Income (Expense} (9) (13) (16) (22) (28) Consolidated Net Income 2,550 2,540 2,840 4,217 4,659 Minority Interest Expense 37 40 56 66 96 Net Income 2,513 2,500 2,783 4,151 4,564 - Net Income Growth -0.49% 11.33% 49.13% 9.942% -Net Margin Growth 14.03% - Extraordinaries & Discontinued Operations -- Extra Items & Gain/Loss Sale Of Assets Cumulative Effect - Accounting Chg -- Discontinued Operations 0 0 Net Income After Extraordinaries 2,513 2,500 2,783 4,151 4,564 Preferred Dividends Preferred Dividends 0 0 ----- Net Income Available to common 2,513 2,500 2,783 4,151 4,564 EPS (Basic} 1.28 1.20 1.30 1.91 2.09 - EPS (Basic) Growth -6.25% 8.133% 46.97% 9.339% - -L Basic Shares Outstanding 1,967 2,081 2,145 2,177 2,189 EPS (Diluted} 1.26 1.20 1.30 1.91 2.07 - EPS (Diluted) Growth -4.762% 8.133% 46.97% 8.689% - Diluted Shares Outstanding 1,999 2,089 2,145 2,177 2,202 EBITDA 4,390 4,809 5,312 7,063 7,394 - EBITDA Growth 9.544% 10.46% 32.96% 4.685% ...1 - EBITDA Margin 22.73% Fiscal Year January-December. All Values are in USD Millions 2015 2016 2017 2018 2019 5-Year Trend Sales/Revenue 26,554 23,003 29,367 36.862 32,526 - Sales Growth -13.37% 27.67% 25.52% -11.77% Cost of Goods Sold (COGS) incl. D&A 23,575 19,682 25,631 31,487 27,013 - COGS Growth -16.51% 30.23% 22.85% -14.21% - COGS excluding D&A 22,059 18,130 23,987 29,695 25,021 - Depreciation & Amortization Expense 1,516 1,552 1,644 1,792 1,992 -- Depreciation 1,167 1,220 1,302 1,442 1,613 -- Amortization of Intangibles 349 333 342 349 379 Gross Income 2,979 3,321 3,737 5,375 5,513 - Gross Income Growth 11.49% 12.51% 43.85% 2.556% - Gross Profit Margin 16.95% SG&A Expense 104 111 6.75% - SGA Growth -38.84% 6.708% 51.61% - Research & Development - Other SG&A 105 104 111 L - Other Operating Expense Unusual Expense 128 (56) 179 Non Operating Income/Expense (86) (141) Non-Operating Interest Income 0 0 Equity in Affiliates (Pretax} 374 362 426 480 563 Interest Expense 927 945 944 1,059 1,111 - Interest Expense Growth 2.008% -0.095% 12.12% 4.931% -L - Gross Interest Expense 1,076 1,113 1,136 1,207 1,255 - Interest Capitalized 149 168 192 148 144 Pretax Income 2,556 2,576 2,881 4.299 4,733 - Pretax Income Growth 0.802% 11.83% 49.2% 10.09% - Pretax Margin 14.55% TINT-71139-1 Income Tax 0 - Income Tax - Current Domestic - Income Tax - Current Foreign LI - Income Tax - Deferred Domestic - Income Tax - Deferred Foreign - Income Tax Credits 00 Equity in Affiliates 0 0 0 0 Other After Tax Income (Expense} (9) (13) (16) (22) (28) Consolidated Net Income 2,550 2,540 2,840 4,217 4,659 Minority Interest Expense 37 40 56 66 96 Net Income 2,513 2,500 2,783 4,151 4,564 - Net Income Growth -0.49% 11.33% 49.13% 9.942% -Net Margin Growth 14.03% - Extraordinaries & Discontinued Operations -- Extra Items & Gain/Loss Sale Of Assets Cumulative Effect - Accounting Chg -- Discontinued Operations 0 0 Net Income After Extraordinaries 2,513 2,500 2,783 4,151 4,564 Preferred Dividends Preferred Dividends 0 0 ----- Net Income Available to common 2,513 2,500 2,783 4,151 4,564 EPS (Basic} 1.28 1.20 1.30 1.91 2.09 - EPS (Basic) Growth -6.25% 8.133% 46.97% 9.339% - -L Basic Shares Outstanding 1,967 2,081 2,145 2,177 2,189 EPS (Diluted} 1.26 1.20 1.30 1.91 2.07 - EPS (Diluted) Growth -4.762% 8.133% 46.97% 8.689% - Diluted Shares Outstanding 1,999 2,089 2,145 2,177 2,202 EBITDA 4,390 4,809 5,312 7,063 7,394 - EBITDA Growth 9.544% 10.46% 32.96% 4.685% ...1 - EBITDA Margin 22.73%


