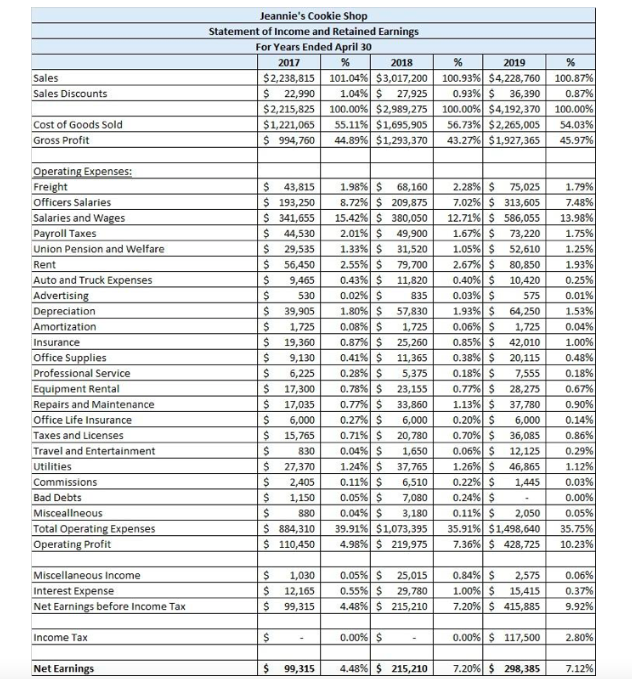
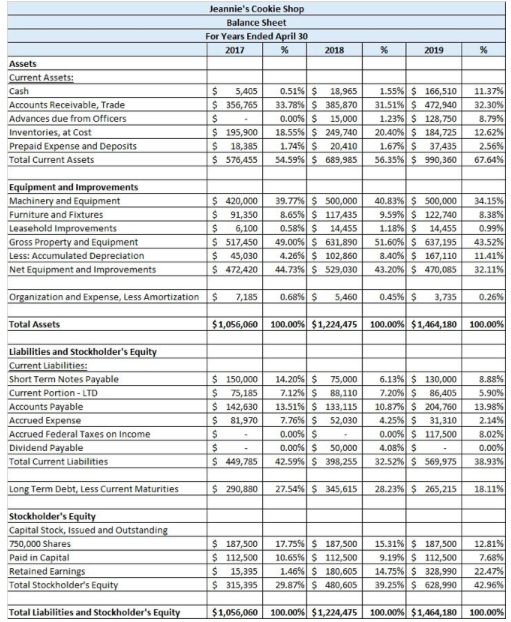
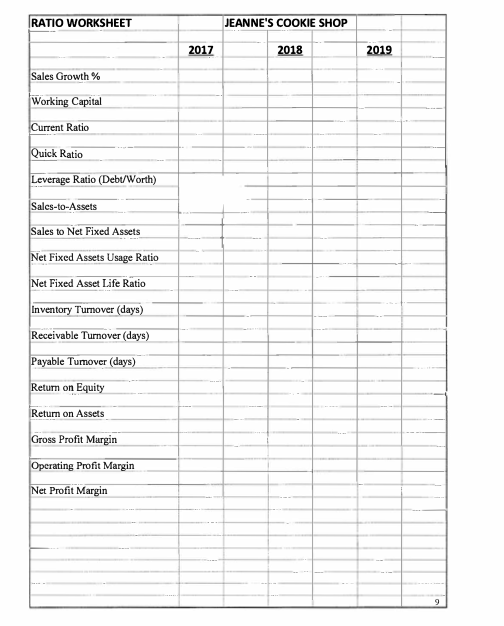
Using this information primarily on the balance sheet. Please complete the Ratio worksheet for 2017, 2018, and 2019 and show all work.


Sales Sales Discounts Jeannie's Cookie Shop Statement of Income and retained Earnings For Years Ended April 30 2017 % 2018 $2,238,815 101.04% $3,017,200 $ 22,990 1.04% $ 27,925 $2,215,825 100.00% $2,989,275 $1,221,065 55.11% $1,695,905 $ 994,760 44.89% $1,293,370 % 2019 100.93% $4,228,760 0.93% $ 36,390 100.00% $4,192,370 56.73% $2,265,005 43.27% $1,927,365 % 100.87% 0.87% 100.00% 54.03% 45.97% Cost of Goods Sold Gross Profit Operating Expenses: Freight Officers Salaries Salaries and Wages Payroll Taxes Union Pension and Welfare Rent Auto and Truck Expenses Advertising Depreciation Amortization Insurance Office Supplies Professional Service Equipment Rental Repairs and Maintenance Office Life Insurance Taxes and Licenses Travel and Entertainment Utilities Commissions Bad Debts Miscealineous Total Operating Expenses Operating Profit UUUUUUUUUUUUUU $ 43,815 $ 193,250 $ 341,655 $ 44,530 $ 29,535 $ 56,450 $ 9,465 $ 530 $ 39,905 $ 1,725 $ 19,360 $ 9,130 6,225 $ 17,300 17,035 6,000 $ 15,765 $ 830 $ 27,370 $ 2,405 1,150 $ 880 $ 884,310 $ 110,450 1.98% $ 68,160 8.72% $ 209,875 15.42% $ 380,050 2.01% $ 49,900 1.33% $ 31,520 2.55% $ 79,700 0.43% $ 11,820 0.02% $ 835 1.80% 57,830 0.08% $ 1,725 0.87% $ 25,260 0.41% $ 11,365 0.28% $ 5,375 0.78% $ 23,155 0.77% $ 33,860 0.27% $ 6,000 0.71% $ 20,780 0.04% $ 1,650 1.24% S 37,765 0.11% $ 6,510 0.05% S 7,080 0.04% $ 3,180 39.91% $1,073,395 4.98% $ 219,975 2.28% $ 75,025 7.02% $ 313,605 12.71% S 586,055 1.67% $ 73,220 1.05% $ 52,610 2.67% $ 80,850 0.40% $ 10,420 0.039 $ 575 1.93% $ 64,250 0.06% $ 1,725 0.85% $ 42,010 0.38% S 20,115 0.18% S 7,555 0.77% $ 28,275 1.13% $ 37,780 0.20% $ 6,000 0.70% $ 36,085 0.06% $ 12,125 1.26% $ 46,865 0.22% $ 1,445 0.24% $ 0.11% $ 2,050 35.91% $1,498,640 7.36% $ 428,725 1.79% 7.48% 13.98% 1.75% 1.25% 1.93% 0.25% 0.01% 1.53% 0.04% 1.00% 0.48% 0.18% 0.67% 0.90% 0.14% 0.86% 0.29% 1.12% 0.03% 0.00% 0.05% 35.75% 10.23% Miscellaneous Income Interest Expense Net Earnings before Income Tax ulus $ $ 1,030 12,165 99,315 0.05% S 25,015 0.55% $ 29,780 4.48% $ 215, 210 0.84% $ 2,575 1.00% $ 15,415 7.20% $ 415,885 0.06% 0.37% 9.92% Income Tax $ 0.00% $ 0.00% $ 117,500 2.80% Net Earnings 99,315 4.48% $ 215,210 7.20% $ 298,385 7.12% Jeannie's Cookie Shop Balance Sheet For Years Ended April 30 2017 % 2018 % 2019 % Assets Current Assets: Cash Accounts Receivable, Trade Advances due from Officers Inventories, at Cost Prepaid Expense and Deposits Total Current Assets $ 5,405 $ 356,765 $ $ 195,900 $ 18,385 $ 576,455 0.51% $ 18,965 33.78% $ 385,870 0.00% $ 15,000 18.55% $ 249,740 1.74% $ 20,410 54.59% $ 689,985 1.55% $ 166,510 31.51% $ 472,940 1.23% $ 128,750 20.40% $ 184,725 1.67% $ 37,435 56.35% $ 990,360 11.37% 32.30% 8.79% 12.62% 2.56% 67.64% Equipment and Improvements Machinery and Equipment Furniture and Fixtures Leasehold Improvements Gross Property and Equipment Less: Accumulated Depreciation Net Equipment and improvements $ 420,000 $ 91,350 $ 6,100 $ 517,450 $ 45,030 $ 472,420 39.77% $ 500,000 8.65% $ 117,435 0.58% $ 14,455 49.00% $ 631,890 4.26% $ 102,860 44.73% $ 529,030 40.83% $ 500,000 9.59% $ 122,740 1.18% $ 14,455 51.60% $ 637,195 8.40% $ 167, 110 43.20% $ 470,085 34.15% 8.38% 0.99% 43.52% 11.41% 32.11% Organization and Expense, Less Amortization $ 7,185 0.68% $ 5,460 0.45% $ 3,735 0.26% Total Assets $1,056,060 100.00% $1,224,475 100.00% $1,464,180 100.00% Liabilities and Stockholder's Equity Current Liabilities: Short Term Notes Payable Current Portion - LTD Accounts Payable Accrued Expense Accrued Federal Taxes on Income Dividend Payable Total Current Liabilities $ 150,000 $ 75,185 $ 142,630 $ 81,970 $ $ $ 449,785 14.20% $ 75,000 7.12% $ 88,110 13.51% $ 133,115 7.76% $ 52,030 0.00% $ 0.00% $ 50,000 42.59% $ 398,255 6.13% $ 130,000 7.20% $ 86,405 10.87% $ 204,760 4.25% $ 31,310 0.00% $ 117,500 4.08% $ 32.52% $ 569,975 8.88% 5.90% 13.98% 2.14% 8.02% 0.00% 38.93% Long Term Debt, Less Current Maturities $ 290,880 27.54% $ 345,615 28.23% $ 265,215 18.11% Stockholder's Equity Capital Stock, issued and Outstanding 750,000 Shares Paid in Capital Retained Earnings Total Stockholder's Equity $ 187,500 $ 112,500 $ 15,395 $ 315,395 17.75%$ 187,500 10.65% $ 112,500 1.46% $ 180,605 29.87% $ 480,605 15.31% $ 187,500 9.19% $ 112,500 14.75% $ 328,990 39.25% $ 628,990 12.81% 7.68% 22.47% 42.96% Total Liabilities and Stockholder's Equity $1,056,060 100.00% $1,224,475 100.00% $1,464,180 100.00% RATIO WORKSHEET JEANNE'S COOKIE SHOP 2017 2018 2019 Sales Growth % Working Capital Current Ratio Quick Ratio Leverage Ratio (Debt/Worth) Sales-to-Assets Sales to Fixed Assets Net Fixed Assets Usage Ratio Net Fixed Asset Life Ratio Inventory Turnover (days) Receivable Turnover (days) Payable Tumover (days) Return on Equity Return on Assets Gross Profit Margin Operating Profit Margin Net Profit Margin


