USING THIS TABLES;
FILL IN THE VALUES OF THIS TABLE.
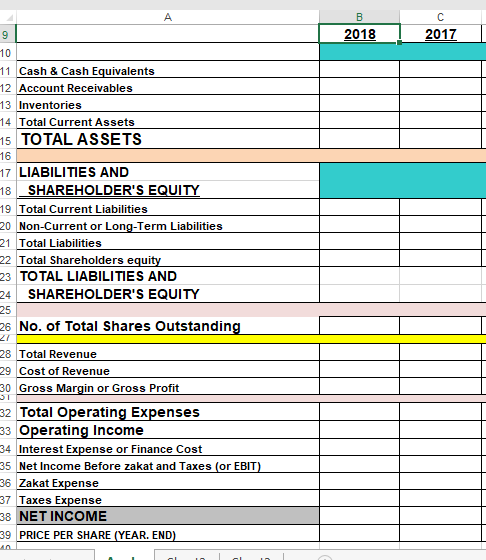
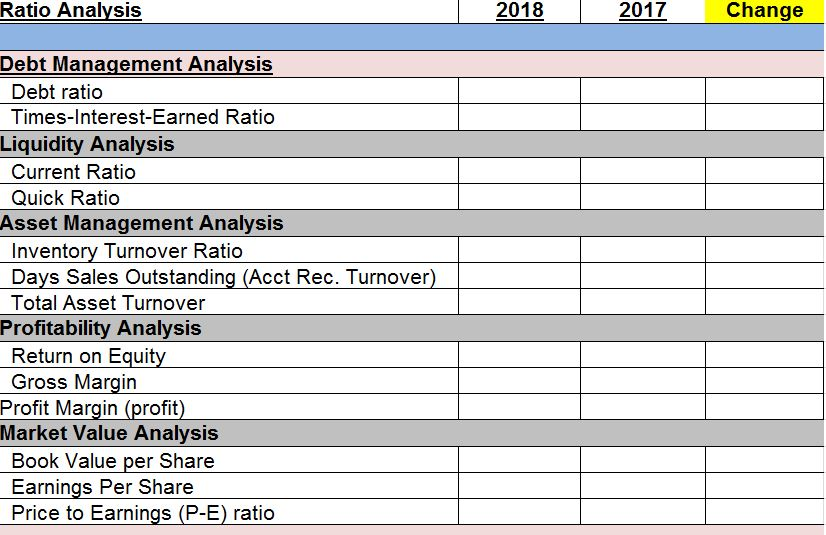
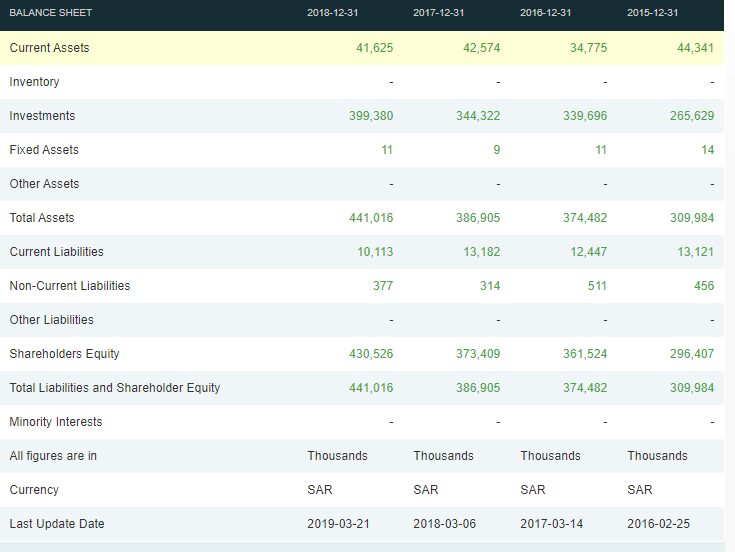
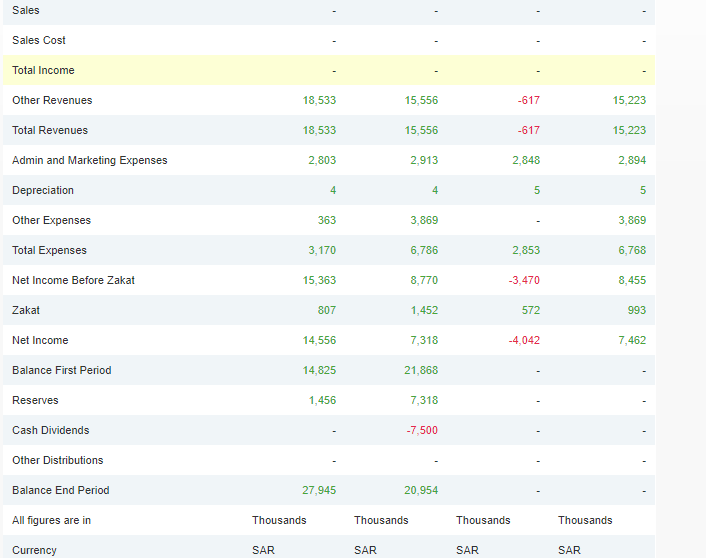
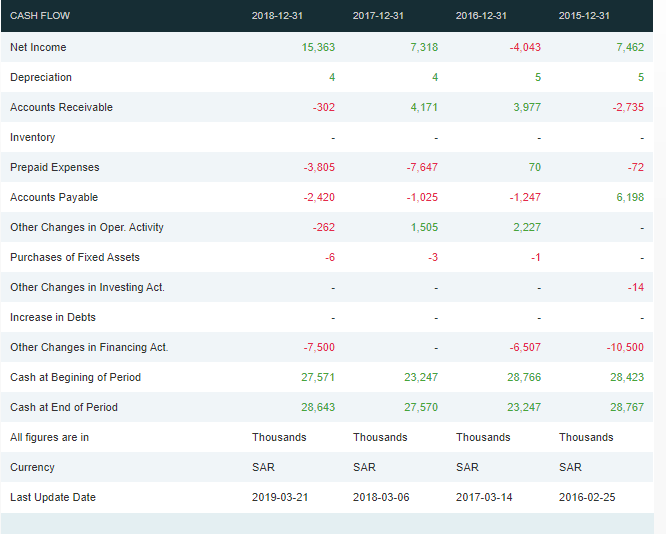
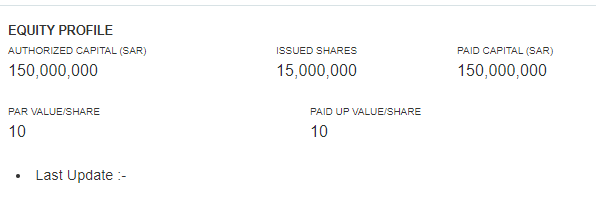
BALANCE SHEET 2018-12-31 2017-12-31 2016-12-31 2015-12-31 Current Assets 41,625 42,574 34,775 44,341 Inventory Investments 399,380 344,322 339,696 265,629 Fixed Assets 11 Other Assets Total Assets 441,016 386,905 374,482 309,984 Current Liabilities 10,113 13,182 13,121 12,447 511 Non-Current Liabilities 377 314 456 Other Liabilities Shareholders Equity 430,526 373,409 361,524 296,407 Total Liabilities and Shareholder Equity 441,016 386,905 374,482 309,984 Minority Interests All figures are in Thousands Thousands Thousands Thousands Currency SAR SAR SAR SAR Last Update Date 2019-03-21 2018-03-06 2017-03-14 2016-02-25 All figures are in Thousands Thousands Thousands Thousands Currency SAR SAR SAR SAR Last Update Date 2019-03-21 2018-03-06 2017-03-14 2016-02-25 Sales Sales Cost Total Income Other Revenues 18,533 15,556 -617 15,223 Total Revenues 18,533 15,556 -617 15,223 Admin and Marketing Expenses 2,803 2,913 2,848 2,894 Depreciation Other Expenses 363 3,869 3,869 Total Expenses 3,170 6,786 2,853 6,768 Net Income Before Zakat 15,363 8,770 -3,470 8,455 Zakat 807 1,452 572 993 Net Income 14,556 7,318 -4,042 7,462 Balance First Period 14,825 21,868 Reserves 1,456 7,318 Cash Dividends -7,500 Other Distributions Balance End Period 27,945 20,954 All figures are in Thousands Thousands Thousands Thousands Currency SAR SAR SAR SAR CASH FLOW 2018-12-31 2017-12-31 2016-12-31 2015-12-31 Net Income 15,363 7,318 -4,043 Depreciation 5 Accounts Receivable -302 4,171 3,977 Inventory Prepaid Expenses -3,805 -7,647 70 Accounts Payable -2,420 -1,025 -1,247 Other Changes in Oper. Activity 1,505 2,227 Purchases of Fixed Assets Other Changes in Investing Act. Increase in Debts Other Changes in Financing Act. -7,500 -6,507 -10,500 Cash at Begining of Period 27,571 23,247 28,766 28,423 Cash at End of Period 28,643 27,570 23,247 28,767 All figures are in Thousands Thousands Thousands Thousands Currency SAR SAR SAR SAR Last Update Date 2019-03-21 2018-03-06 2017-03-14 2016-02-25 EQUITY PROFILE AUTHORIZED CAPITAL (SAR) 150.000.000 ISSUED SHARES 15,000,000 PAID CAPITAL (SAR) 150,000,000 PAR VALUE/SHARE PAID UP VALUE/SHARE 10 10 Last Update :- 2018 ! 2017 11 Cash & Cash Equivalents 12 Account Receivables 13 Inventories 14 Total Current Assets 15 TOTAL ASSETS 16 17 LIABILITIES AND 18 SHAREHOLDER'S EQUITY 19 Total Current Liabilities 20 Non-Current or Long-Term Liabilities 21 Total Liabilities 22 Total Shareholders equity 23 TOTAL LIABILITIES AND 24 SHAREHOLDER'S EQUITY 26 No. of Total Shares Outstanding 28 Total Revenue 29 Cost of Revenue 30 Gross Margin or Gross Profit 32 Total Operating Expenses 33 Operating Income 34 Interest Expense or Finance Cost 35 Net Income Before zakat and Taxes (or EBIT) 36 Zakat Expense 37 Taxes Expense 38 NET INCOME 39 PRICE PER SHARE (YEAR. END) Ratio Analysis 2018 2017 Change Debt Management Analysis Debt ratio Times-Interest-Earned Ratio Liquidity Analysis Current Ratio Quick Ratio Asset Management Analysis Inventory Turnover Ratio Days Sales Outstanding (Acct Rec. Turnover) Total Asset Turnover Profitability Analysis Return on Equity Gross Margin Profit Margin (profit) Market Value Analysis Book Value per Share Earnings Per Share Price to Earnings (P-E) ratio BALANCE SHEET 2018-12-31 2017-12-31 2016-12-31 2015-12-31 Current Assets 41,625 42,574 34,775 44,341 Inventory Investments 399,380 344,322 339,696 265,629 Fixed Assets 11 Other Assets Total Assets 441,016 386,905 374,482 309,984 Current Liabilities 10,113 13,182 13,121 12,447 511 Non-Current Liabilities 377 314 456 Other Liabilities Shareholders Equity 430,526 373,409 361,524 296,407 Total Liabilities and Shareholder Equity 441,016 386,905 374,482 309,984 Minority Interests All figures are in Thousands Thousands Thousands Thousands Currency SAR SAR SAR SAR Last Update Date 2019-03-21 2018-03-06 2017-03-14 2016-02-25 All figures are in Thousands Thousands Thousands Thousands Currency SAR SAR SAR SAR Last Update Date 2019-03-21 2018-03-06 2017-03-14 2016-02-25 Sales Sales Cost Total Income Other Revenues 18,533 15,556 -617 15,223 Total Revenues 18,533 15,556 -617 15,223 Admin and Marketing Expenses 2,803 2,913 2,848 2,894 Depreciation Other Expenses 363 3,869 3,869 Total Expenses 3,170 6,786 2,853 6,768 Net Income Before Zakat 15,363 8,770 -3,470 8,455 Zakat 807 1,452 572 993 Net Income 14,556 7,318 -4,042 7,462 Balance First Period 14,825 21,868 Reserves 1,456 7,318 Cash Dividends -7,500 Other Distributions Balance End Period 27,945 20,954 All figures are in Thousands Thousands Thousands Thousands Currency SAR SAR SAR SAR CASH FLOW 2018-12-31 2017-12-31 2016-12-31 2015-12-31 Net Income 15,363 7,318 -4,043 Depreciation 5 Accounts Receivable -302 4,171 3,977 Inventory Prepaid Expenses -3,805 -7,647 70 Accounts Payable -2,420 -1,025 -1,247 Other Changes in Oper. Activity 1,505 2,227 Purchases of Fixed Assets Other Changes in Investing Act. Increase in Debts Other Changes in Financing Act. -7,500 -6,507 -10,500 Cash at Begining of Period 27,571 23,247 28,766 28,423 Cash at End of Period 28,643 27,570 23,247 28,767 All figures are in Thousands Thousands Thousands Thousands Currency SAR SAR SAR SAR Last Update Date 2019-03-21 2018-03-06 2017-03-14 2016-02-25 EQUITY PROFILE AUTHORIZED CAPITAL (SAR) 150.000.000 ISSUED SHARES 15,000,000 PAID CAPITAL (SAR) 150,000,000 PAR VALUE/SHARE PAID UP VALUE/SHARE 10 10 Last Update :- 2018 ! 2017 11 Cash & Cash Equivalents 12 Account Receivables 13 Inventories 14 Total Current Assets 15 TOTAL ASSETS 16 17 LIABILITIES AND 18 SHAREHOLDER'S EQUITY 19 Total Current Liabilities 20 Non-Current or Long-Term Liabilities 21 Total Liabilities 22 Total Shareholders equity 23 TOTAL LIABILITIES AND 24 SHAREHOLDER'S EQUITY 26 No. of Total Shares Outstanding 28 Total Revenue 29 Cost of Revenue 30 Gross Margin or Gross Profit 32 Total Operating Expenses 33 Operating Income 34 Interest Expense or Finance Cost 35 Net Income Before zakat and Taxes (or EBIT) 36 Zakat Expense 37 Taxes Expense 38 NET INCOME 39 PRICE PER SHARE (YEAR. END) Ratio Analysis 2018 2017 Change Debt Management Analysis Debt ratio Times-Interest-Earned Ratio Liquidity Analysis Current Ratio Quick Ratio Asset Management Analysis Inventory Turnover Ratio Days Sales Outstanding (Acct Rec. Turnover) Total Asset Turnover Profitability Analysis Return on Equity Gross Margin Profit Margin (profit) Market Value Analysis Book Value per Share Earnings Per Share Price to Earnings (P-E) ratio