

Answered step by step
Verified Expert Solution
Question
1 Approved Answer
Variables for data set: Explanatory Variable: Age Response Variable: IAT-Race-Score Prompt: For the explanatory variable Age and the response variable IAT-Race-Score , use StatCrunch to
Variables for data set: Explanatory Variable: Age
Response Variable: IAT-Race-Score Prompt:
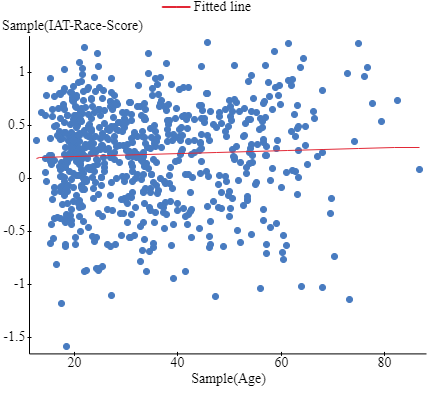
- For the explanatory variable Age and the response variable IAT-Race-Score, use StatCrunch to graph the scatterplot with its regression line and produce the regression equation with r-squared and the standard error - all at the same time.
- Simple linear regression results: Dependent Variable: Sample(IAT-Race-Score) Independent Variable: Sample(Age) Sample(IAT-Race-Score) = 0.17775024 + 0.0013732031 Sample(Age) Sample size: 700 R (correlation coefficient) = 0.044046146 R-sq = 0.001940063 Estimate of error standard deviation: 0.4617503
Step by Step Solution
There are 3 Steps involved in it
Step: 1

Get Instant Access to Expert-Tailored Solutions
See step-by-step solutions with expert insights and AI powered tools for academic success
Step: 2

Step: 3
Ace Your Homework with AI
Get the answers you need in no time with our AI-driven, step-by-step assistance
Get Started
Advanced Engineering Mathematics
Authors: Erwin Kreyszig
10th edition
470458364, 470458365, 978-0470458365