Answered step by step
Verified Expert Solution
Link Copied!

Question

1 Approved Answer

Via Python 1. Generate a list of 2000 Gaussian distributed random numbers with mean 2 and standard deviation 3. 2. Make a scatter plot random
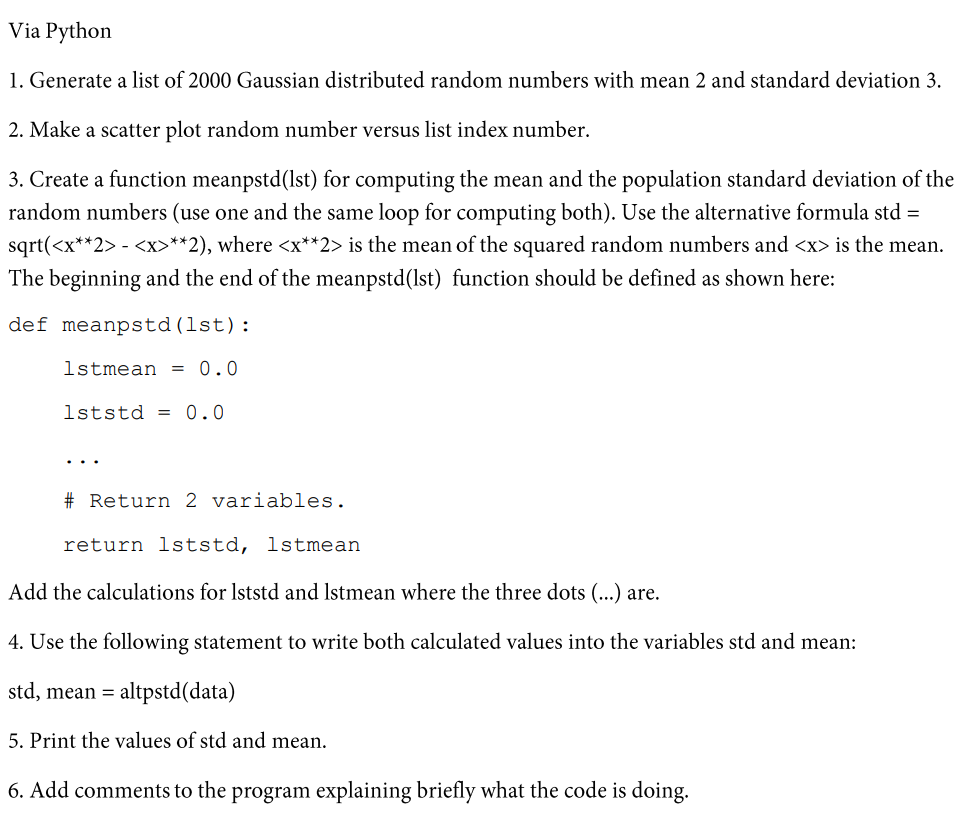
image text in transcribed

Via Python 1. Generate a list of 2000 Gaussian distributed random numbers with mean 2 and standard deviation 3. 2. Make a scatter plot random number versus list index number. 3. Create a function meanpstd(lst) for computing the mean and the population standard deviation of the random numbers (use one and the same loop for computing both). Use the alternative formula std = sqrt(x2>x2), where x2> is the mean of the squared random numbers and x is the mean. The beginning and the end of the meanpstd(lst) function should be defined as shown here: def meanpstd(lst): lstmean =0.0 lststd =0.0 \# Return 2 variables. return lststd, lstmean Add the calculations for lststd and lstmean where the three dots (...) are. 4. Use the following statement to write both calculated values into the variables std and mean: std, mean =altpstd( data ) 5. Print the values of std and mean. 6. Add comments to the program explaining briefly what the code is doing

Step by Step Solution

There are 3 Steps involved in it

Step: 1

blur-text-image

Get Instant Access to Expert-Tailored Solutions

See step-by-step solutions with expert insights and AI powered tools for academic success

Step: 2

blur-text-image_2

Step: 3

blur-text-image_3

Ace Your Homework with AI

Get the answers you need in no time with our AI-driven, step-by-step assistance

Get Started

Recommended Textbook for

Database And Expert Systems Applications 24th International Conference Dexa 2013 Prague Czech Republic August 2013 Proceedings Part 1 Lncs 8055

Authors: Hendrik Decker ,Lenka Lhotska ,Sebastian Link ,Josef Basl ,A Min Tjoa

2013 Edition

3642402844, 978-3642402845

More Books

Students also viewed these Databases questions