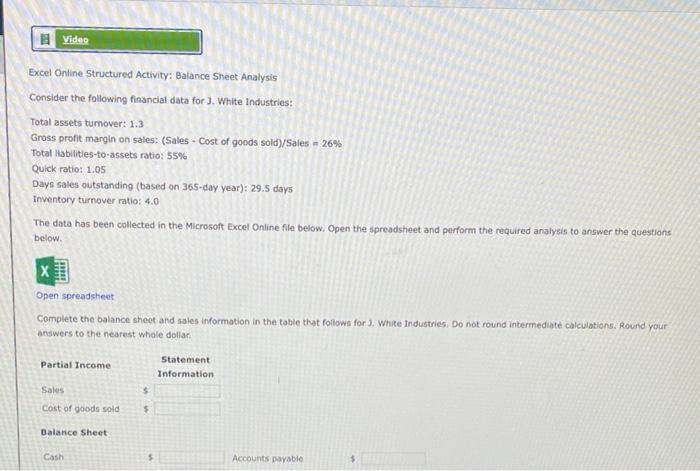
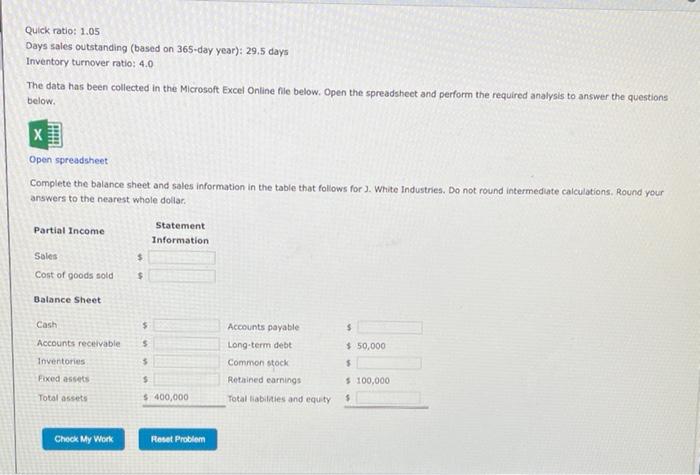
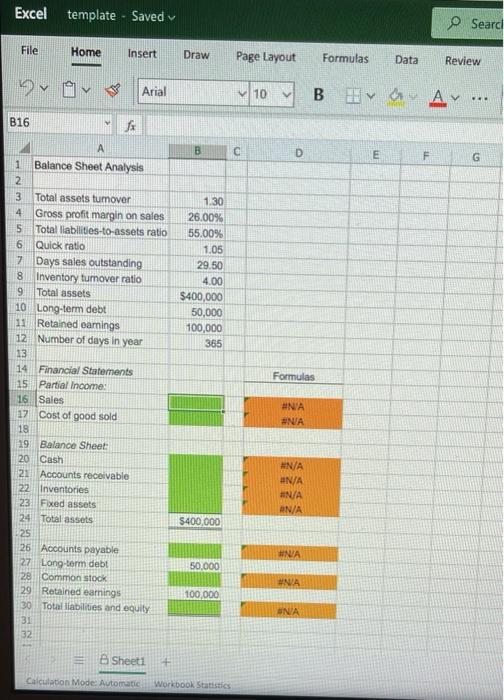
Video Excel Online Structured Activity: Balance Sheet Analysis Consider the following financial data for J. White Industries: Total assets turnover: 1.3 Gross profit margin on sales: (Sales. Cost of goods sold)/Sales - 26% Total Habilities-to-assets ratio: 55% Quick ratio: 1.05 Days sales outstanding (based on 365-day year): 29.5 days Inventory turnover ratio: 4.0 The data has been collected in the Microsoft Excel Online file below. Open the spreadsheet and perform the required analysis to answer the questions below. Open spreadsheet Complete the balance sheet and sales information in the table that follows for). Whire Industries. Do not round intermediate calculations. Round your answers to the nearest whale dollar Partial Income Statement Information $ Sales Cost of goods sold $ Balance Sheet Cash Accounts payable Quick ratio: 1.05 Days sales outstanding (based on 365-day year): 29.5 days Inventory turnover ratio: 4.0 The data has been collected in the Microsoft Excel Online file below. Open the spreadsheet and perform the required analysis to answer the questions below X Open spreadsheet Complete the balance sheet and sales information in the table that follows for). White Industries. Do not round Intermediate calculations, Round your answers to the nearest whole dollar. Partial Income Statement Information $ Sales Cost of goods sold $ Balance Sheet Cash $ $ Accounts receivable $ $50,000 $ $ Accounts payable Long-term debt Common stock Retained earnings Total liabilities and equity Inventories Fixed assets Total assets $ $100,000 $ 400,000 $ Check My Work Reset Problem Excel template Saved Seard File Home Insert Draw Page Layout Formulas Data Review pv 0 Arial 10 . B C D E F G NM N 00 1.30 26.00% 55.00% 1.05 29.50 4.00 $400,000 50,000 100,000 365 B16 fo A Balance Sheet Analysis 2 Total assets tumover Gross profit margin on sales 5 Total liabilities-to-assets ratio Quick ratio 7 Days sales outstanding 8 Inventory tumover ratio 9 Total assets 10 Long-term debt 11 Retained earnings 12 Number of days in year 13 14 Financial Statements 15 Partial Income: 16. Sales 17 Cost of good sold 18 19 Balance Sheet: 20 Cash 21 Accounts receivable 22 Inventories 23 Fixed assets 24 Total assets 25 26 Accounts payable 27 Long-term debt 28 Common stock 29 Retained earnings 30 Total liabilities and equity 31 32 Formulas ANA ANA #N/A #N/A #N/A AN/A $400,000 #NA 50.000 WNA 100,000 NA Sheet + Calculation Mode: Automatic Workbook Statistics


