Answered step by step
Verified Expert Solution
Link Copied!

Question

1 Approved Answer

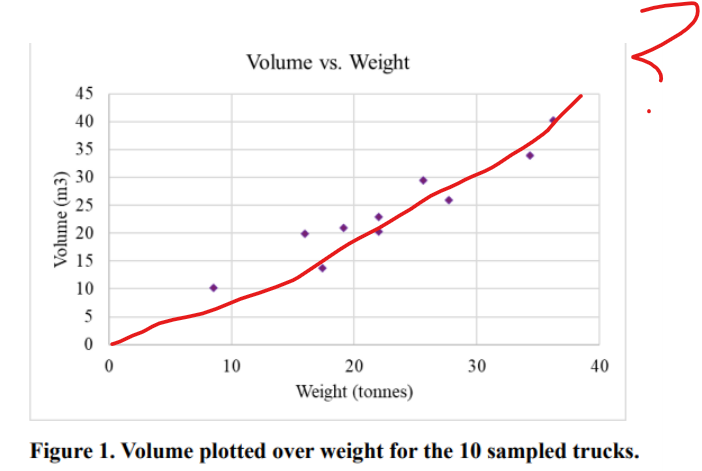
Volume vs. Weight 45 Volume (m3) O 10 20 30 40 Weight (tonnes) Figure 1. Volume plotted over weight for the 10 sampled trucks.1. Based
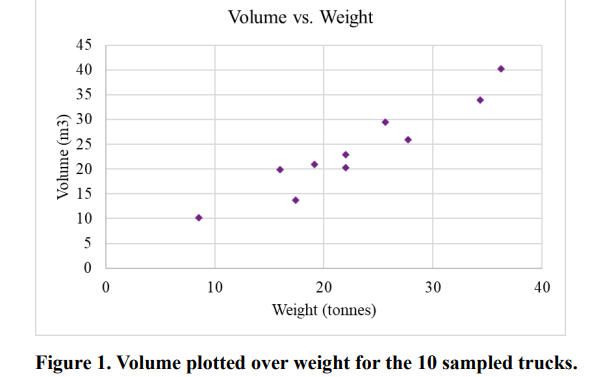
image text in transcribedimage text in transcribedimage text in transcribedimage text in transcribed
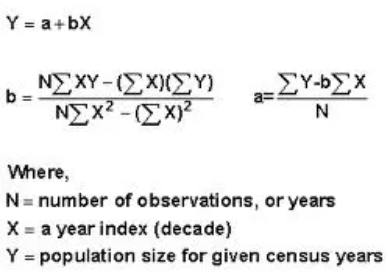
Volume vs. Weight 45 Volume (m3) O 10 20 30 40 Weight (tonnes) Figure 1. Volume plotted over weight for the 10 sampled trucks.1. Based on Figure 1, answer the following: a. Do you think truck weight is linearly related to volume? Explain in 1-2 sentences. b. Does the data meet the assumption that the relationship between X and Y passes through the ongin? Y = a+bX b = NEXY- (EX)(EY) EY-bEx NEX2 - () X ) N Where, N = number of observations, or years X = a year index (decade) Y = population size for given census yearsVolume vs. Weight 45 40 35 Volume (m3) 10 20 30 40 Weight (tonnes) Figure 1. Volume plotted over weight for the 10 sampled trucks
Step by Step Solution

There are 3 Steps involved in it

Step: 1

blur-text-image

Get Instant Access to Expert-Tailored Solutions

See step-by-step solutions with expert insights and AI powered tools for academic success

Step: 2

blur-text-image

Step: 3

blur-text-image

Ace Your Homework with AI

Get the answers you need in no time with our AI-driven, step-by-step assistance

Get Started

Recommended Textbook for

Intro Stats

Authors: Richard D. De Veaux, Paul F. Velleman, David E. Bock

3rd edition

321533283, 321533289, 9780321463708, 9780321503848, 9780321503800, 9780321499431, 9780321499417, 978-0321500458

More Books

Students also viewed these Mathematics questions

Question

The sketch shows the p.d.f. of X where f(x)-x2, 0

Answered: 1 week ago