Answered step by step
Verified Expert Solution
Link Copied!

Question

1 Approved Answer

Walton Bookstore has two type of next year's calendars it could order. They need to determine how much to order in each typeof calendars. Irrespective

Walton Bookstore has two type of next year's calendars it could order. They need to determine how much to order in each typeof calendars.

Irrespective of the type, each calendar costs the bookstore $7.50 and sells for $10. After January 1, all unsold calendars will be returned to the publisher for a refund of $2.50 per calendar.

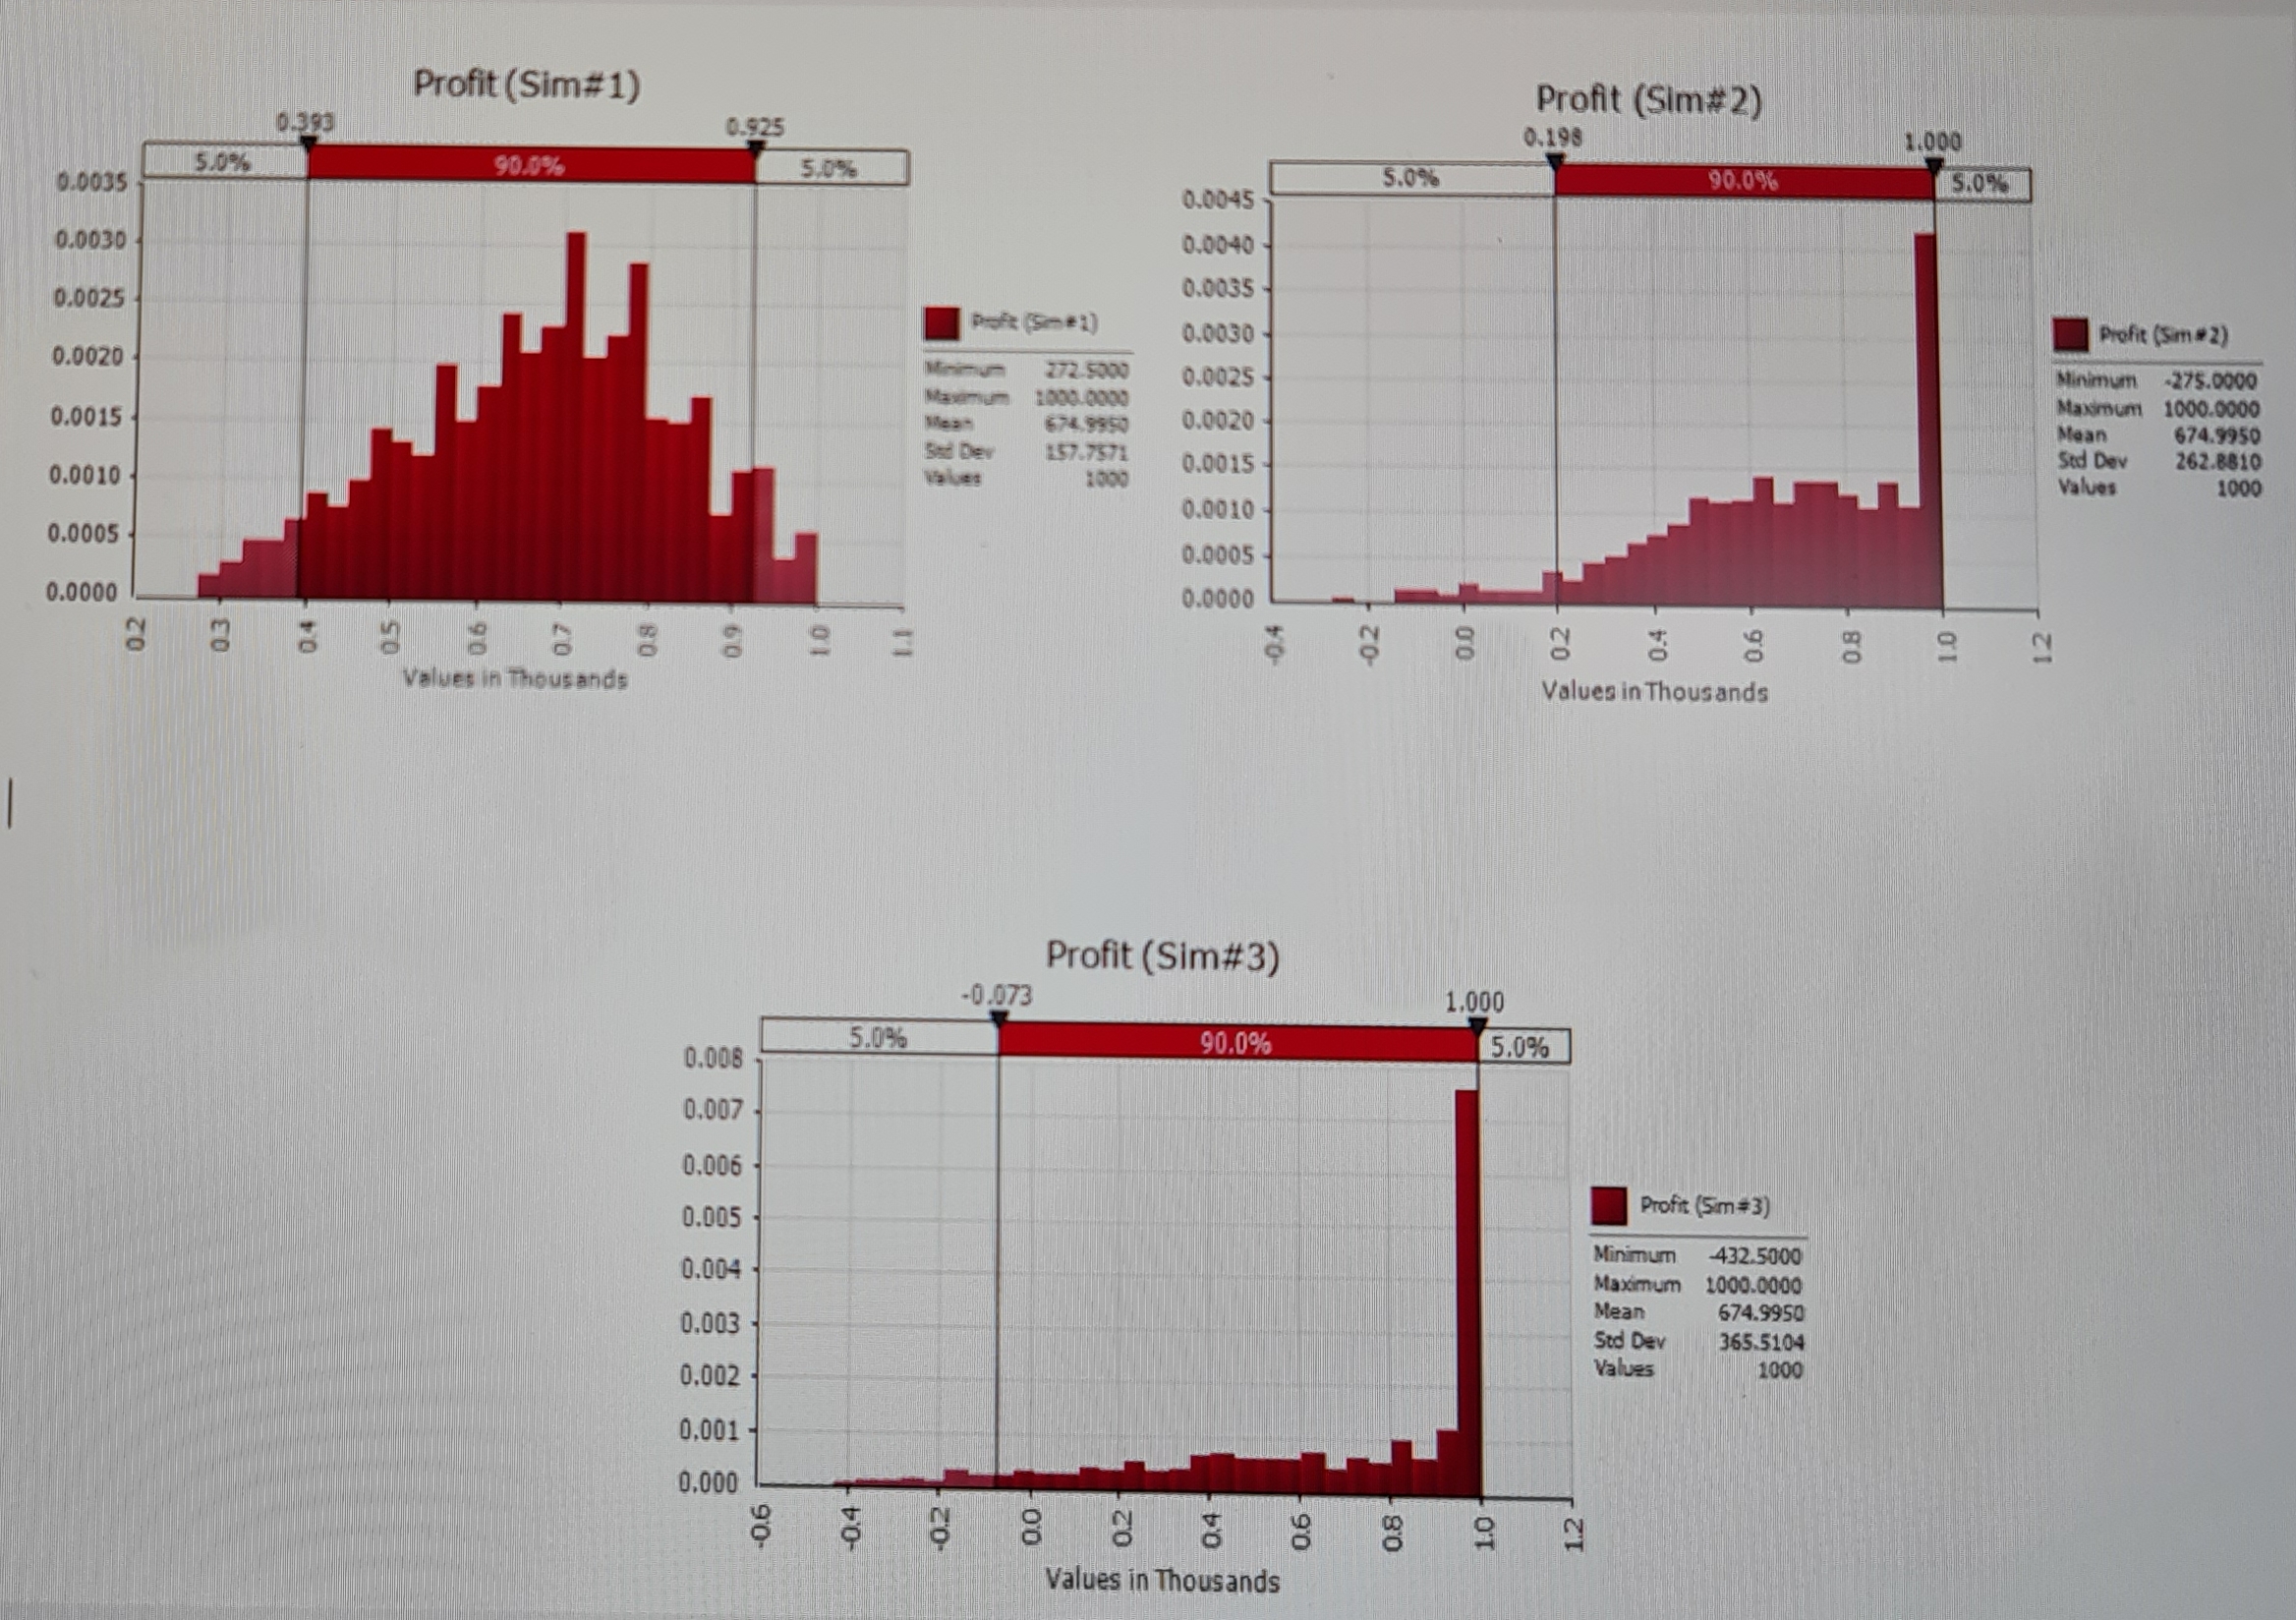
Walton believes that the demand for each type of calendar follows a triangular distribution given in Table 1.Walton Bookstore is unsure whether the demands for the two types of calendars are positively correlated or negatively correlated or not correlated.Hence they have considered three scenarios namely, the correlation between the demand of the two types of calendars is [1] -0.9, [2] 0.0, and [3] 0.9.

You may useTables, 1 and 2provided with the information needed foranswering the question below:

Table 1
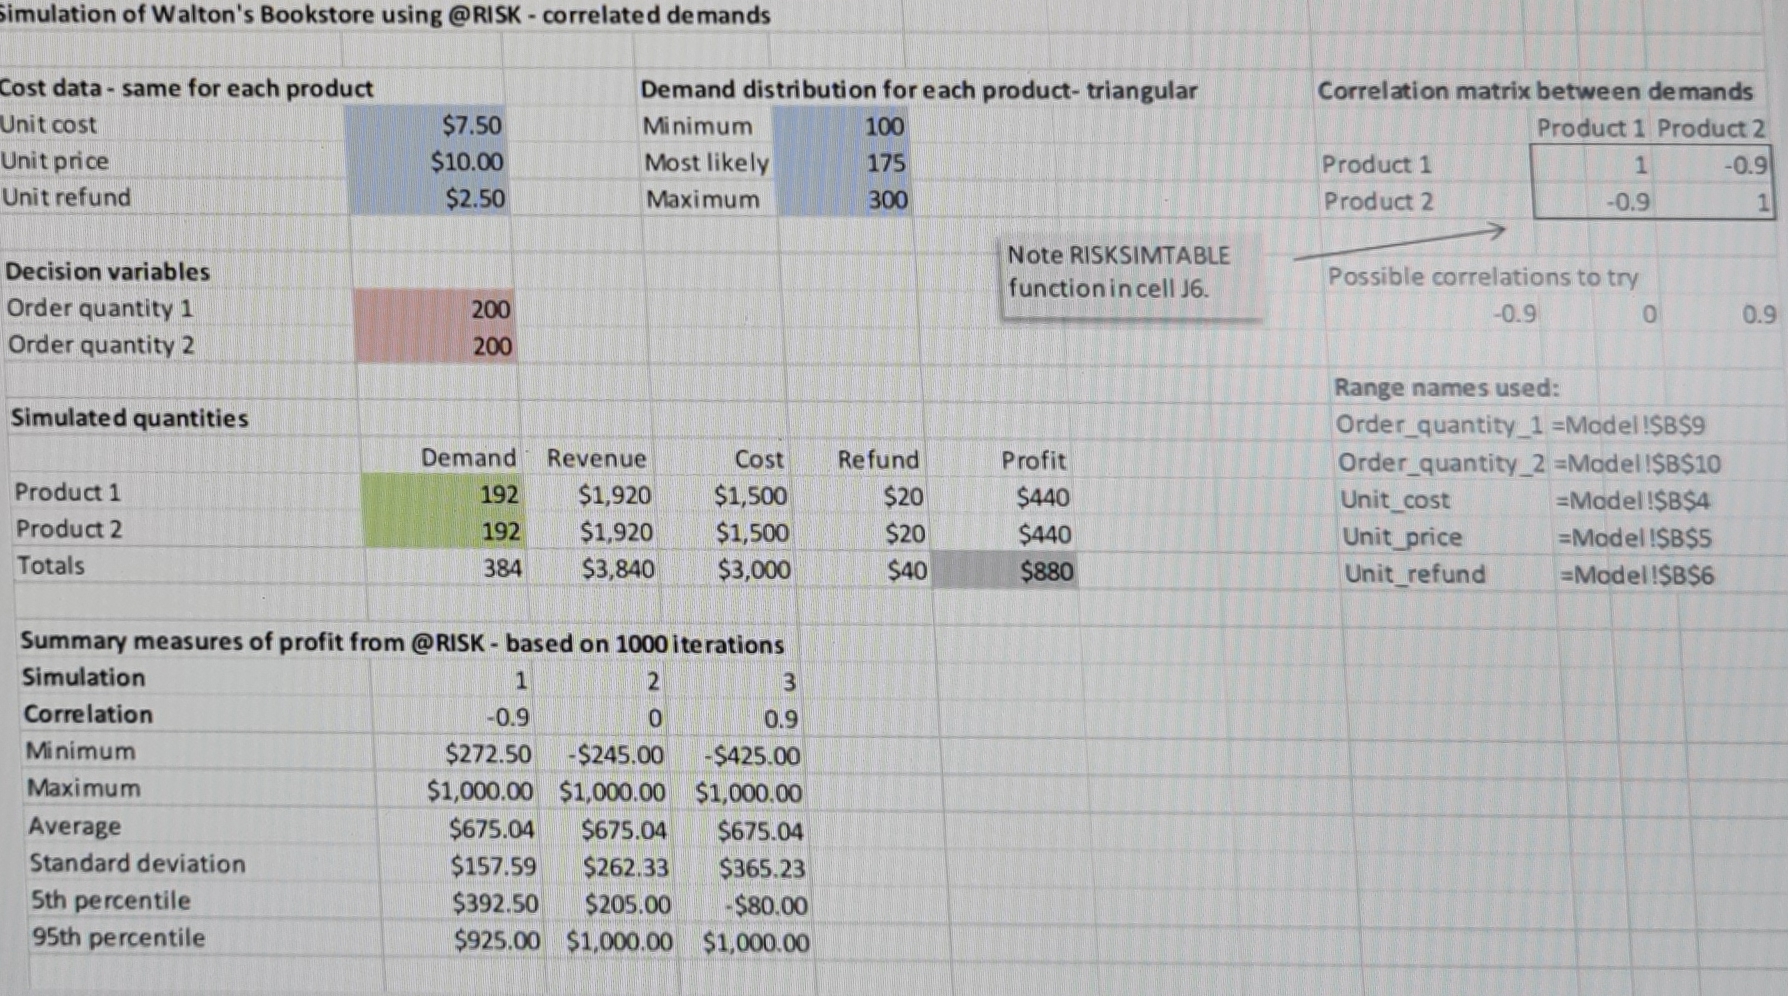
image text in transcribedimage text in transcribed
simulation of Walton's Bookstore using @RISK - correlated demands Cost data - same for each product Demand distribution for each product- triangular Correlation matrix between demands Unit cost $7.50 Minimum 100 Product 1 Product 2 Unit price $10.00 Most likely 175 Product 1 1 -0.9 Unit refund $2.50 Maximum 300 Product 2 -0.9 Note RISKSIMTABLE Decision variables function in cell J6. Possible correlations to try Order quantity 1 200 -0.9 0 0.9 Order quantity 2 200 Range names used: Simulated quantities Order quantity_1 =Model!SB$9 Demand Revenue Cost Refund Profit Order_quantity_2 =Model!SB$10 Product 1 192 $1,920 $1,500 $20 $440 Unit cost =Model!SB$4 Product 2 192 $1,920 $1,500 $20 $440 Unit price =Model!SB$5 Totals 384 $3,840 $3,000 $40 $880 Unit refund =Model!SB$6 Summary measures of profit from @RISK - based on 1000 ite rations Simulation N Correlation -0.9 0 0.9 Minimum $272.50 -$245.00 -$425.00 Maximum $1,000.00 $1,000.00 $1,000.00 Average $675.04 $675.04 $675.04 Standard deviation $157.59 $262.33 $365.23 5th percentile $392.50 $205.00 $80.00 95th percentile $925.00 $1,000.00 $1,000.00Profit (Sim#1) Profit (Sim#2) 0.393 0.925 0.198 1.000 5.0% 90.0% 5,0% 0.0035 S.0% 90.0% 5.0% 0.0045 0.0030 0.0040 0.0035 0.0025 Profit (5mm # 1) 0.0030 Profit (Sim # 2) 0.0020 272 5000 0.0025 Minimum -275.0000 1020.0000 Maximum 1000.5000 0.0015 Meat 574,8950 0.0020 Mean 674.9950 Bad Der 157.7571 Sed Dev 262.8810 0.0010 1600 0.0015 Values 1000 0.0010 0.0005 0.0005 0.0000 0.0000 Values in Thousands Values in Thousands Profit (Sim#3) -0.073 1,000 5.0% 90.0% 0.008 5.0% 0.007 0.006 0.005 Profit (Sim# 3) Minimum 432.5000 0.004 Maximum 1000.0000 Mean 674.9950 0.003 Std Dev 365.5104 0.002 Values 1000 0,001 0,000 0.2 0.6 -0.4 8 g Values in Thousands

Step by Step Solution

There are 3 Steps involved in it

Step: 1

blur-text-image

Get Instant Access to Expert-Tailored Solutions

See step-by-step solutions with expert insights and AI powered tools for academic success

Step: 2

blur-text-image

Step: 3

blur-text-image

Ace Your Homework with AI

Get the answers you need in no time with our AI-driven, step-by-step assistance

Get Started

Recommended Textbook for

Essentials Of Systems Analysis And Design

Authors: Joseph Valacich, Joey F George

5th Edition

0133469530, 9780133469530

More Books

Students also viewed these General Management questions