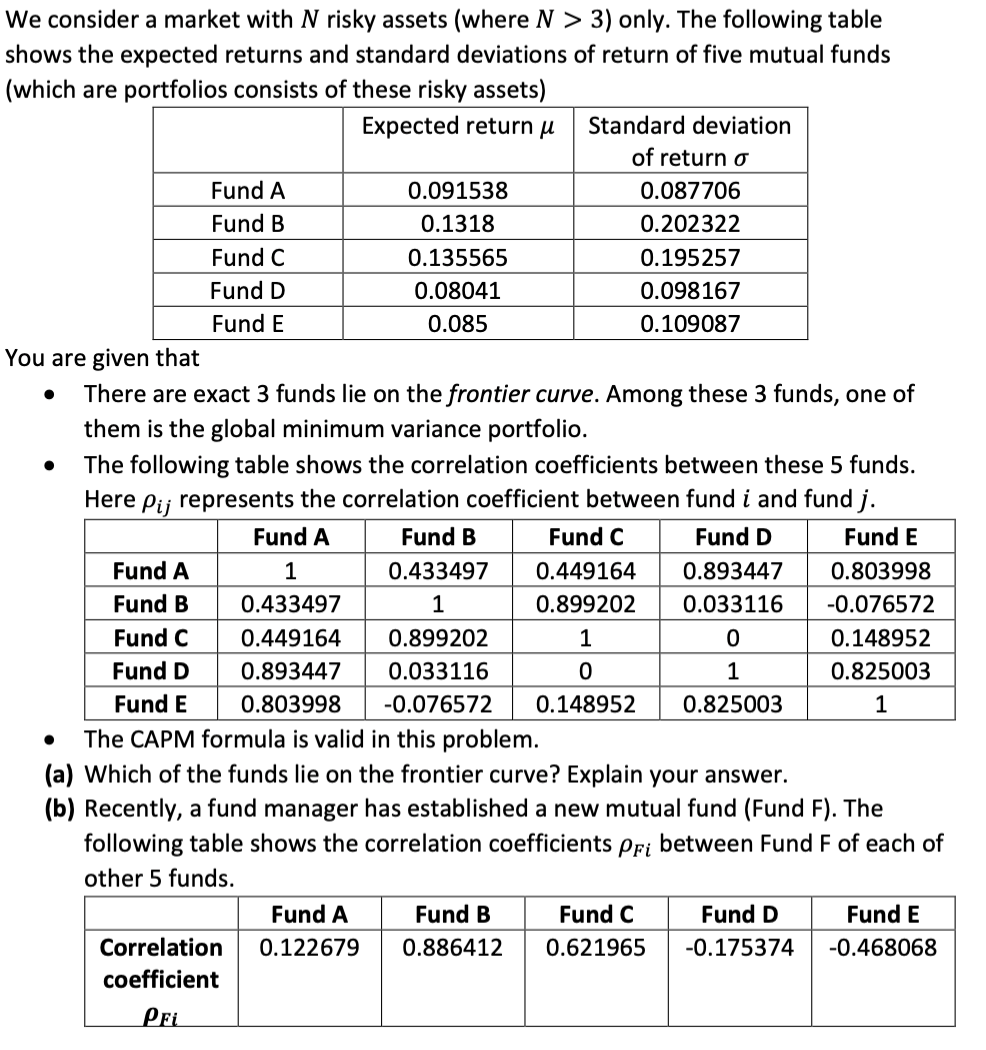

. We consider a market with N risky assets (where N > 3) only. The following table shows the expected returns and standard deviations of return of five mutual funds (which are portfolios consists of these risky assets) Expected return u Standard deviation of return o Fund A 0.091538 0.087706 Fund B 0.1318 0.202322 Fund C 0.135565 0.195257 Fund D 0.08041 0.098167 Fund E 0.085 0.109087 You are given that There are exact 3 funds lie on the frontier curve. Among these 3 funds, one of them is the global minimum variance portfolio. The following table shows the correlation coefficients between these 5 funds. Here Pij represents the correlation coefficient between fund i and fund j. Fund A Fund B Fund C Fund D Fund E Fund A 1 0.433497 0.449164 0.893447 0.803998 Fund B 0.433497 1 0.899202 0.033116 -0.076572 Fund C 0.449164 0.899202 1 0 0.148952 Fund D 0.893447 0.033116 0 1 0.825003 Fund E 0.803998 -0.076572 0.148952 0.825003 1 The CAPM formula is valid in this problem. (a) Which of the funds lie on the frontier curve? Explain your answer. (b) Recently, a fund manager has established a new mutual fund (Fund F). The following table shows the correlation coefficients pri between Fund F of each of other 5 funds. Fund A Fund B Fund C Fund D Fund E Correlation 0.122679 0.886412 0.621965 -0.175374 -0.468068 coefficient Pfi It is also given that the standard deviation of Fund F's return is of = 0.714843. Find the expected return of Fund Fusing suitable CAPM formula. . We consider a market with N risky assets (where N > 3) only. The following table shows the expected returns and standard deviations of return of five mutual funds (which are portfolios consists of these risky assets) Expected return u Standard deviation of return o Fund A 0.091538 0.087706 Fund B 0.1318 0.202322 Fund C 0.135565 0.195257 Fund D 0.08041 0.098167 Fund E 0.085 0.109087 You are given that There are exact 3 funds lie on the frontier curve. Among these 3 funds, one of them is the global minimum variance portfolio. The following table shows the correlation coefficients between these 5 funds. Here Pij represents the correlation coefficient between fund i and fund j. Fund A Fund B Fund C Fund D Fund E Fund A 1 0.433497 0.449164 0.893447 0.803998 Fund B 0.433497 1 0.899202 0.033116 -0.076572 Fund C 0.449164 0.899202 1 0 0.148952 Fund D 0.893447 0.033116 0 1 0.825003 Fund E 0.803998 -0.076572 0.148952 0.825003 1 The CAPM formula is valid in this problem. (a) Which of the funds lie on the frontier curve? Explain your answer. (b) Recently, a fund manager has established a new mutual fund (Fund F). The following table shows the correlation coefficients pri between Fund F of each of other 5 funds. Fund A Fund B Fund C Fund D Fund E Correlation 0.122679 0.886412 0.621965 -0.175374 -0.468068 coefficient Pfi It is also given that the standard deviation of Fund F's return is of = 0.714843. Find the expected return of Fund Fusing suitable CAPM formula