Answered step by step
Verified Expert Solution
Question
1 Approved Answer
We will study the 2022 Australian election for the House of Representatives. There are 151 members in the House of Representatives one for each


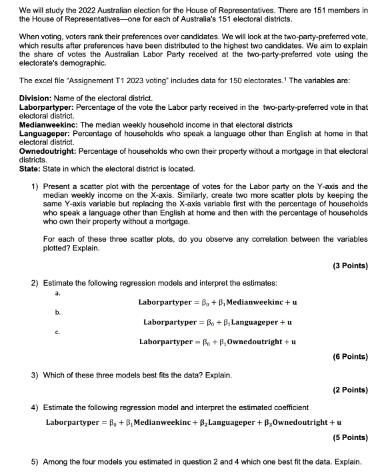
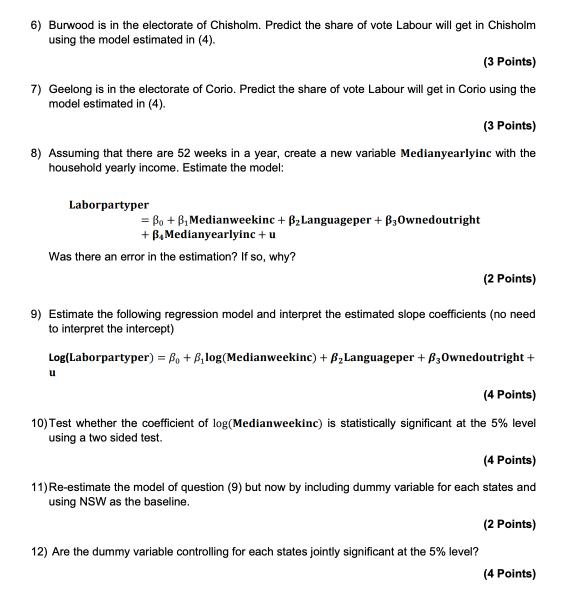
We will study the 2022 Australian election for the House of Representatives. There are 151 members in the House of Representatives one for each of Australia's 151 electoral districts. When voting, voters rank their preferences over candidates. We will look at the two-party-preferred vote, which results after preferences have been distributed to the highest two candidates. We aim to explain the share of votes the Australian Labor Party received at the two-party-preferred vote using the electorate's demographic. The excel file "Assignement T1 2023 voting includes data for 150 electorates. The variables are: Division: Name of the electoral district. Laborpartyper: Percentage of the vote the Labor party received in the two-party-preferred vote in that electoral district, Medianweekinc: The median weekly household income in that electoral districts Languageper: Percentage of households who speak a language other than English at home in that electoral district. Ownedoutright: Percentage of households who own their property without a mortgage in that electoral districts. State: State in which the electoral district is located. 1) Present a scatter plot with the percentage of votes for the Labor party on the Y-axis and the median weekly income on the X-axis. Similarly, create two more scatter plots by keeping the same Y-axis variable but replacing the X-axis variable first with the percentage of households who speak a language other than English at home and then with the percentage of households who own their property without a mortgage. For each of these three scatter plots, do you observe any correlation between the variables plotted? Explain 2) Estimate the following regression models and interpret the estimates: Laborpartyper = 8,+B, Medianweekinc + u Laborpartyper = B + B, Languageper + u Laborpartyper - B+B, Ownedoutright + u 3) Which of these three models best fits the data? Explain. (3 Points) (6 Points) (2 Points) 4) Estimate the following regression model and interpret the estimated coefficient Laborpartyper = 8, +5, Medianweekinc + B, Languageper + B,Ownedoutright + u (5 Points) 5) Among the four models you estimated in question 2 and 4 which one best fit the data. Explain. 6) Burwood is in the electorate of Chisholm. Predict the share of vote Labour will get in Chisholm using the model estimated in (4). (3 Points) 7) Geelong is in the electorate of Corio. Predict the share of vote Labour will get in Corio using the model estimated in (4). (3 Points) 8) Assuming that there are 52 weeks in a year, create a new variable Medianyearlyinc with the household yearly income. Estimate the model: Laborpartyper = Bo + B Medianweekinc + B Languageper + B3Ownedoutright + B, Medianyearlyinc + u Was there an error in the estimation? If so, why? u (2 Points) 9) Estimate the following regression model and interpret the estimated slope coefficients (no need to interpret the intercept) Log(Laborpartyper) = Bo + Blog(Medianweekinc) + BLanguageper + B3Ownedoutright + (4 Points) 10) Test whether the coefficient of log(Medianweekinc) is statistically significant at the 5% level using a two sided test. (4 Points) 11) Re-estimate the model of question (9) but now by including dummy variable for each states and using NSW as the baseline. (2 Points) 12) Are the dummy variable controlling for each states jointly significant at the 5% level? (4 Points)
Step by Step Solution
There are 3 Steps involved in it
Step: 1
Analyzing Australian Election Data 2022 This analysis explores the relationship between the Australian Labor Partys vote share Laborpartyper and various demographic factors in the 2022 election 1 Scat...
Get Instant Access to Expert-Tailored Solutions
See step-by-step solutions with expert insights and AI powered tools for academic success
Step: 2

Step: 3

Ace Your Homework with AI
Get the answers you need in no time with our AI-driven, step-by-step assistance
Get Started


