Answered step by step
Verified Expert Solution
Link Copied!

Question

1 Approved Answer

Week 14: Chapter 12 - Linear Regression Concepts Score: 14.6?!18 121'14 answered . Question 6 V The following table shows retail sales in drug stores
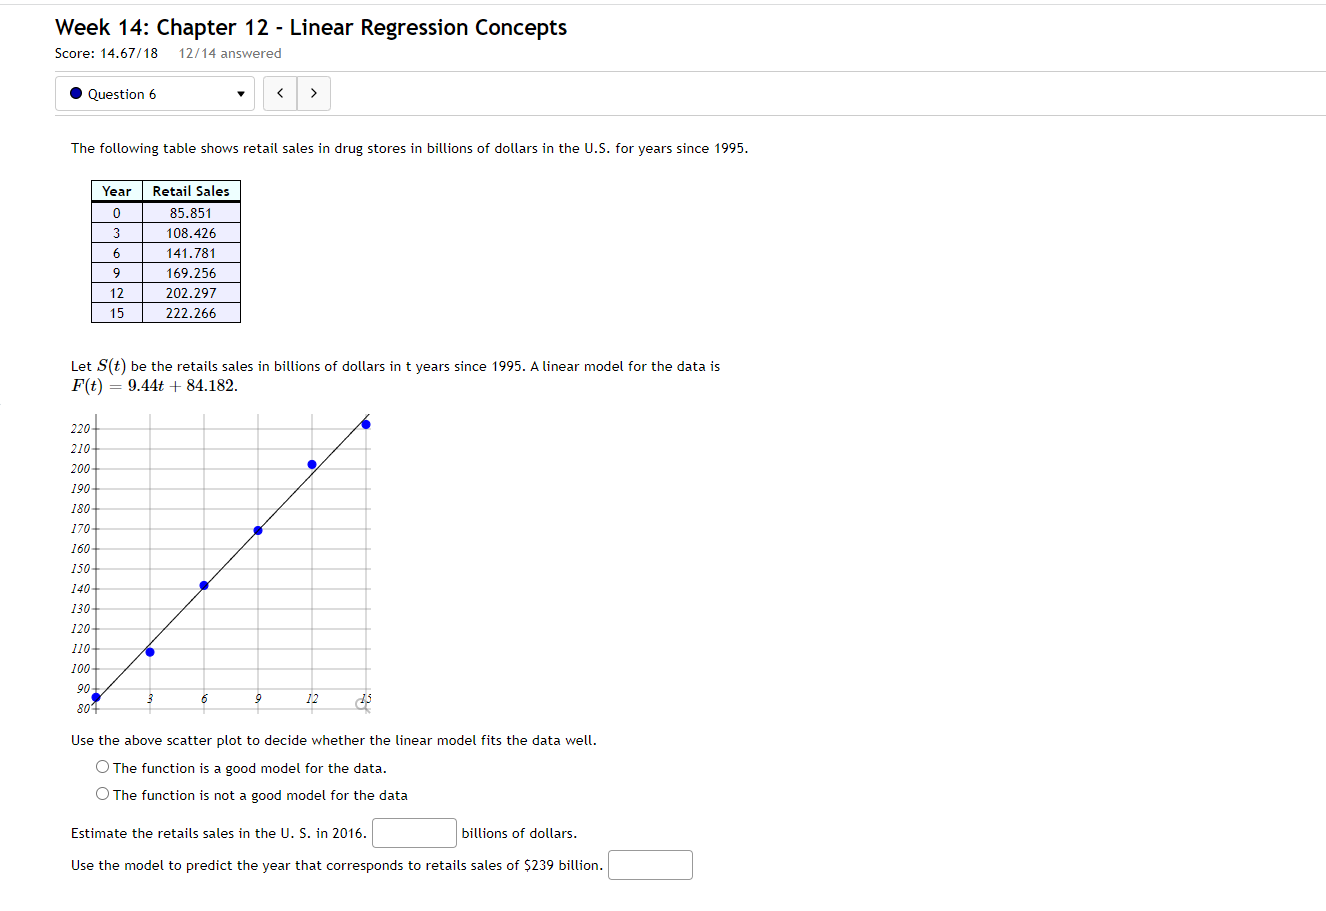
image text in transcribed
Week 14: Chapter 12 - Linear Regression Concepts Score: 14.6?!18 121'14 answered . Question 6 V The following table shows retail sales in drug stores in billions of dollars in the U.S. for years since 1995. Year Retail Sales 0 85.351 3 108.426 6 141 .781 9 169.256 12 202.29? I 5 222.266 Let S\") be the retails sales in billions of dollars in t years since 1995. A linear model for the data is F(t) = 9.4m + 34.132. 220 21:9 29:9 190 180 17 160 150 1'40 1'30 1'20 HE 190 90 80 3' :s 5': 1'2 (55 Use the above scatter plot to decide whether the linear model fits the data well. 0 The function is a good model for the data. 0 The function is not a good model for the data Estimate the retails sales in the U. 5. in 2016. C] billions of dollars. Use the model to predict the year that corresponds to retails sales of $239 billion. |:|

Step by Step Solution

There are 3 Steps involved in it

Step: 1

blur-text-image

Get Instant Access to Expert-Tailored Solutions

See step-by-step solutions with expert insights and AI powered tools for academic success

Step: 2

blur-text-image_2

Step: 3

blur-text-image_3

Ace Your Homework with AI

Get the answers you need in no time with our AI-driven, step-by-step assistance

Get Started

Recommended Textbook for

Calculus An Applied Approach

Authors: Ron Larson, Dennis J McKenzie, Larson/Edwards, Bruce H Edwards

7th Edition

1111809720, 9781111809720

More Books

Students also viewed these Mathematics questions