Answered step by step
Verified Expert Solution
Question
1 Approved Answer
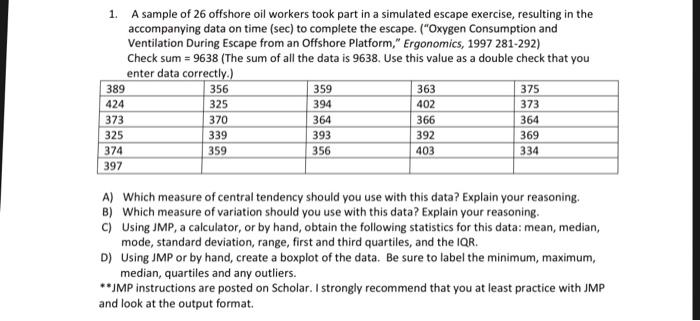
1. A sample of 26 offshore oil workers took part in a simulated escape exercise, resulting in the accompanying data on time (sec) to

1. A sample of 26 offshore oil workers took part in a simulated escape exercise, resulting in the accompanying data on time (sec) to complete the escape. ("Oxygen Consumption and Ventilation During Escape from an Offshore Platform," Ergonomics, 1997 281-292) Check sum= 9638 (The sum of all the data is 9638. Use this value as a double check that you enter data correctly.) 389 424 373 325 374 397 356 325 370 339 359 359 394 364 393 356 363 402 366 392 403 375 373 364 369 334 A) Which measure of central tendency should you use with this data? Explain your reasoning. B) Which measure of variation should you use with this data? Explain your reasoning. C) Using JMP, a calculator, or by hand, obtain the following statistics for this data: mean, median, mode, standard deviation, range, first and third quartiles, and the IQR. D) Using JMP or by hand, create a boxplot of the data. Be sure to label the minimum, maximum, median, quartiles and any outliers. **JMP instructions are posted on Scholar. I strongly recommend that you at least practice with JMP and look at the output format.
Step by Step Solution
★★★★★
3.27 Rating (159 Votes )
There are 3 Steps involved in it
Step: 1
The mean is the most appropriate measure of central tendency to use with this data This is because t...
Get Instant Access to Expert-Tailored Solutions
See step-by-step solutions with expert insights and AI powered tools for academic success
Step: 2

Step: 3

Document Format ( 2 attachments)
635dbe1516b5e_178490.pdf
180 KBs PDF File
635dbe1516b5e_178490.docx
120 KBs Word File
Ace Your Homework with AI
Get the answers you need in no time with our AI-driven, step-by-step assistance
Get Started


