Answered step by step
Verified Expert Solution
Question
1 Approved Answer
What are infographics? Multiple Choice presents the results of data analysis, displaying the patterns, relationships, and trends in a graphical format a business analytics specialist
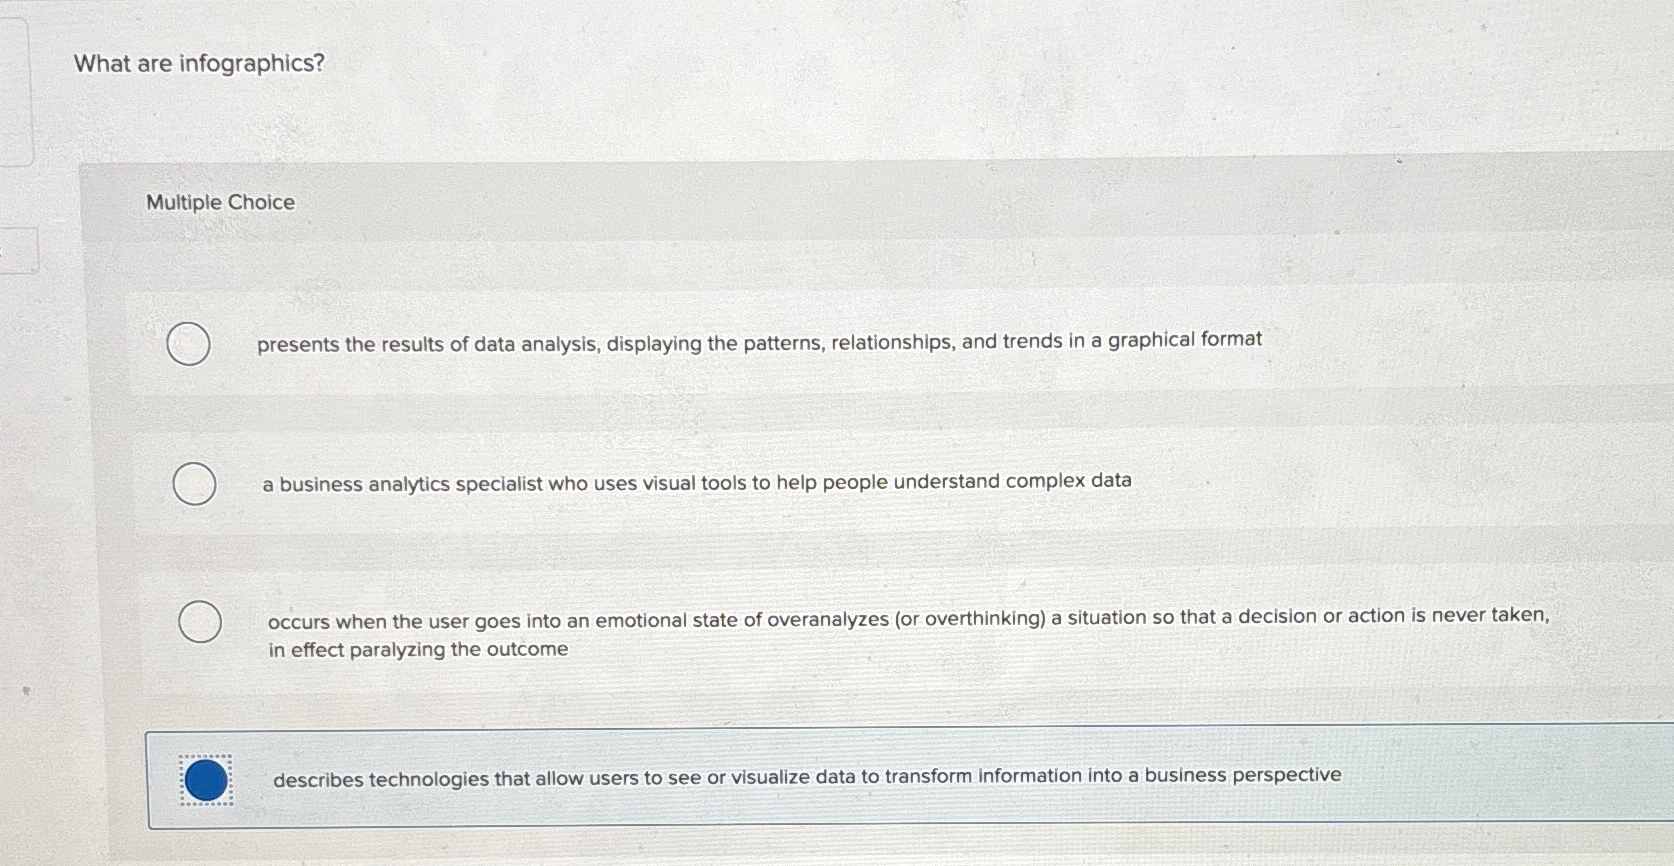
What are infographics?
Multiple Choice
presents the results of data analysis, displaying the patterns, relationships, and trends in a graphical format
a business analytics specialist who uses visual tools to help people understand complex data
occurs when the user goes into an emotional state of overanalyzes or overthinking a situation so that a decision or action is never taken, in effect paralyzing the outcome
describes technologies that allow users to see or visualize data to transform information into a business perspective

Step by Step Solution
There are 3 Steps involved in it
Step: 1

Get Instant Access to Expert-Tailored Solutions
See step-by-step solutions with expert insights and AI powered tools for academic success
Step: 2

Step: 3

Ace Your Homework with AI
Get the answers you need in no time with our AI-driven, step-by-step assistance
Get Started


