What are the short-term liquidity ratios and long term solvency ratios for the company below? This would include coverage ratios and the Altman Z-score. What if any changes occurred in these ratios, is it favorable or unfavorable?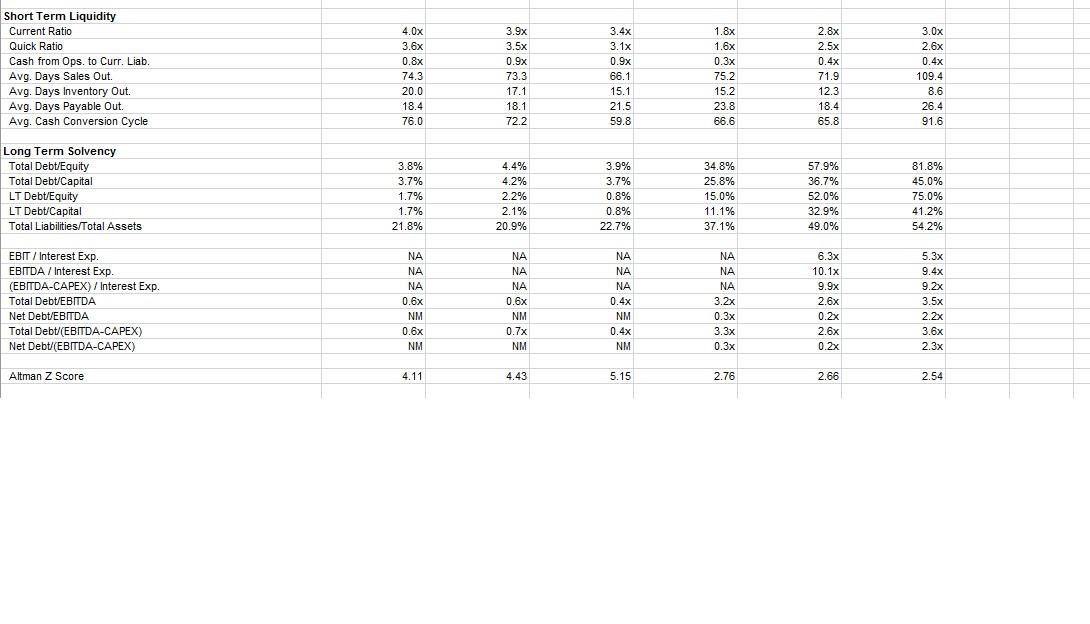
Now using the company information above and the industry information below. What are the similarities and differences compared to industry?
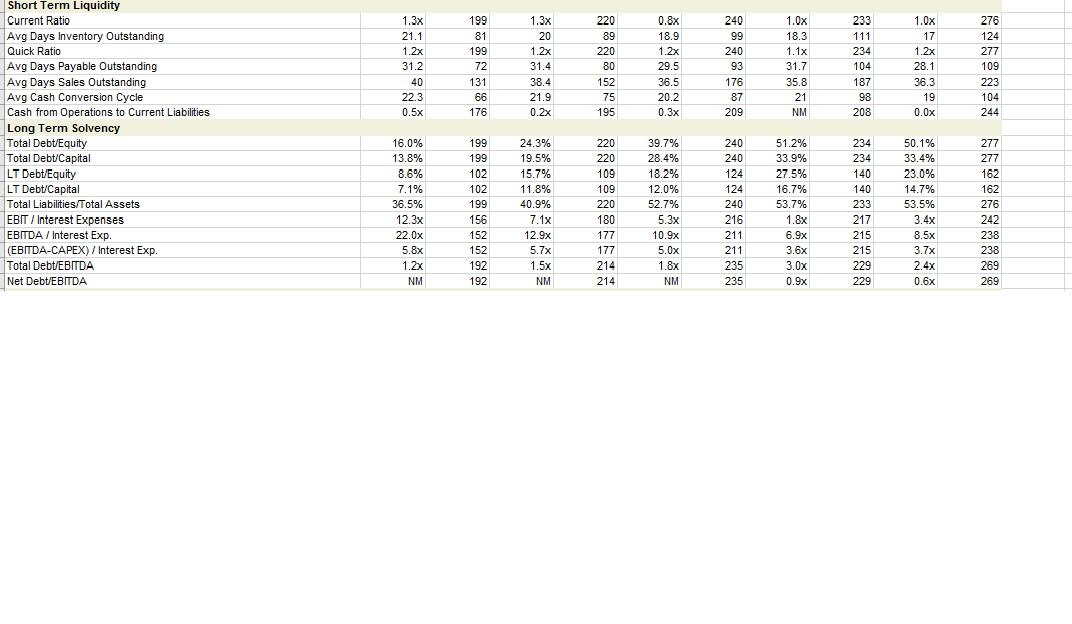
Short Term Liquidity Current Ratio Quick Ratio Cash from Ops. to Curr. Liab. Avg. Days Sales Out Avg. Days Inventory Out. Avg. Days Payable Out. Avg. Cash Conversion Cycle 4.0x 3.6x 0.8x 74.3 20.0 18.4 76.0 3.9x 3.5x 0.9x 73.3 17.1 18.1 72.2 3.4x 3.1x 0.9x 66.1 15.1 21.5 59.8 1.8x 1.6x 0.3x 75.2 15.2 23.8 66.6 2.8x 2.5x 0.4x 71.9 12.3 18.4 65.8 3.Ox 2.6x 0.4x 109.4 8.6 26.4 91.6 Long Term Solvency Total Debt/Equity Total Debt/Capital LT Debt/Equity LT Debt/Capital Total Liabilities/Total Assets 3.8% 3.7% 1.7% 1.7% 21.8% 4.4% 4.2% 2.2% 2.1% 20.9% 3.9% 3.7% 0.8% 0.8% 22.7% 34.8% 25.8% 15.0% 11.1% 37.1% 57.9% 36.7% 52.0% 32.9% 49.0% 81.8% 45.0% 75.0% 41.2% 54.2% NA EBIT / Interest Exp. EBITDA / Interest Exp. (EBITDA-CAPEX) / Interest Exp. -/ Total Debt/EBITDA Net Debt/EBITDA Total Debt/(EBITDA-CAPEX) Net Debt/(EBITDA-CAPEX) NA NA NA 0.6x NM 0.6x NM NA NA 0.6x NM 0.7x NM NA NA NA 0.4x NM 0.4x NM NA NA NA 3.2x 0.3x 3.3x 0.3x 6.3x 10.1x 9.9x 2.6x 0.2x 2.6x 0.2x 5.3x 9.4x 9.2x 3.5x 2.2x 3.6x 2.3x Altman Z Score 4.11 4.43 5.15 2.76 2.66 2.54 O 21.1 o one Outstanding 1.2x Short Term Liquidity Current Ratio Avg Days Inventory Outstanding Quick Ratio Avg Days Payable bustand Avg Days Sales Outstands esh from Operations to Current Liabilities Long Term Solvency Total tal Debt/Equity * 40 223 05 240 Total Debt Capital wo 277 NO 33.4% 23.09% 14.7% 162 LT Debt/Equity LT Debt/Capital Total Liabilities/Total Assets EBIT / Interest Expenses EBITDA / Interest Exp. (EBITDA-CAPEX)/ Interest Exp Total Debt/EBITDA Net Debt/EBITDA 7.1x 5.3x 2 no 2 Noow . Short Term Liquidity Current Ratio Quick Ratio Cash from Ops. to Curr. Liab. Avg. Days Sales Out Avg. Days Inventory Out. Avg. Days Payable Out. Avg. Cash Conversion Cycle 4.0x 3.6x 0.8x 74.3 20.0 18.4 76.0 3.9x 3.5x 0.9x 73.3 17.1 18.1 72.2 3.4x 3.1x 0.9x 66.1 15.1 21.5 59.8 1.8x 1.6x 0.3x 75.2 15.2 23.8 66.6 2.8x 2.5x 0.4x 71.9 12.3 18.4 65.8 3.Ox 2.6x 0.4x 109.4 8.6 26.4 91.6 Long Term Solvency Total Debt/Equity Total Debt/Capital LT Debt/Equity LT Debt/Capital Total Liabilities/Total Assets 3.8% 3.7% 1.7% 1.7% 21.8% 4.4% 4.2% 2.2% 2.1% 20.9% 3.9% 3.7% 0.8% 0.8% 22.7% 34.8% 25.8% 15.0% 11.1% 37.1% 57.9% 36.7% 52.0% 32.9% 49.0% 81.8% 45.0% 75.0% 41.2% 54.2% NA EBIT / Interest Exp. EBITDA / Interest Exp. (EBITDA-CAPEX) / Interest Exp. -/ Total Debt/EBITDA Net Debt/EBITDA Total Debt/(EBITDA-CAPEX) Net Debt/(EBITDA-CAPEX) NA NA NA 0.6x NM 0.6x NM NA NA 0.6x NM 0.7x NM NA NA NA 0.4x NM 0.4x NM NA NA NA 3.2x 0.3x 3.3x 0.3x 6.3x 10.1x 9.9x 2.6x 0.2x 2.6x 0.2x 5.3x 9.4x 9.2x 3.5x 2.2x 3.6x 2.3x Altman Z Score 4.11 4.43 5.15 2.76 2.66 2.54 O 21.1 o one Outstanding 1.2x Short Term Liquidity Current Ratio Avg Days Inventory Outstanding Quick Ratio Avg Days Payable bustand Avg Days Sales Outstands esh from Operations to Current Liabilities Long Term Solvency Total tal Debt/Equity * 40 223 05 240 Total Debt Capital wo 277 NO 33.4% 23.09% 14.7% 162 LT Debt/Equity LT Debt/Capital Total Liabilities/Total Assets EBIT / Interest Expenses EBITDA / Interest Exp. (EBITDA-CAPEX)/ Interest Exp Total Debt/EBITDA Net Debt/EBITDA 7.1x 5.3x 2 no 2 Noow


