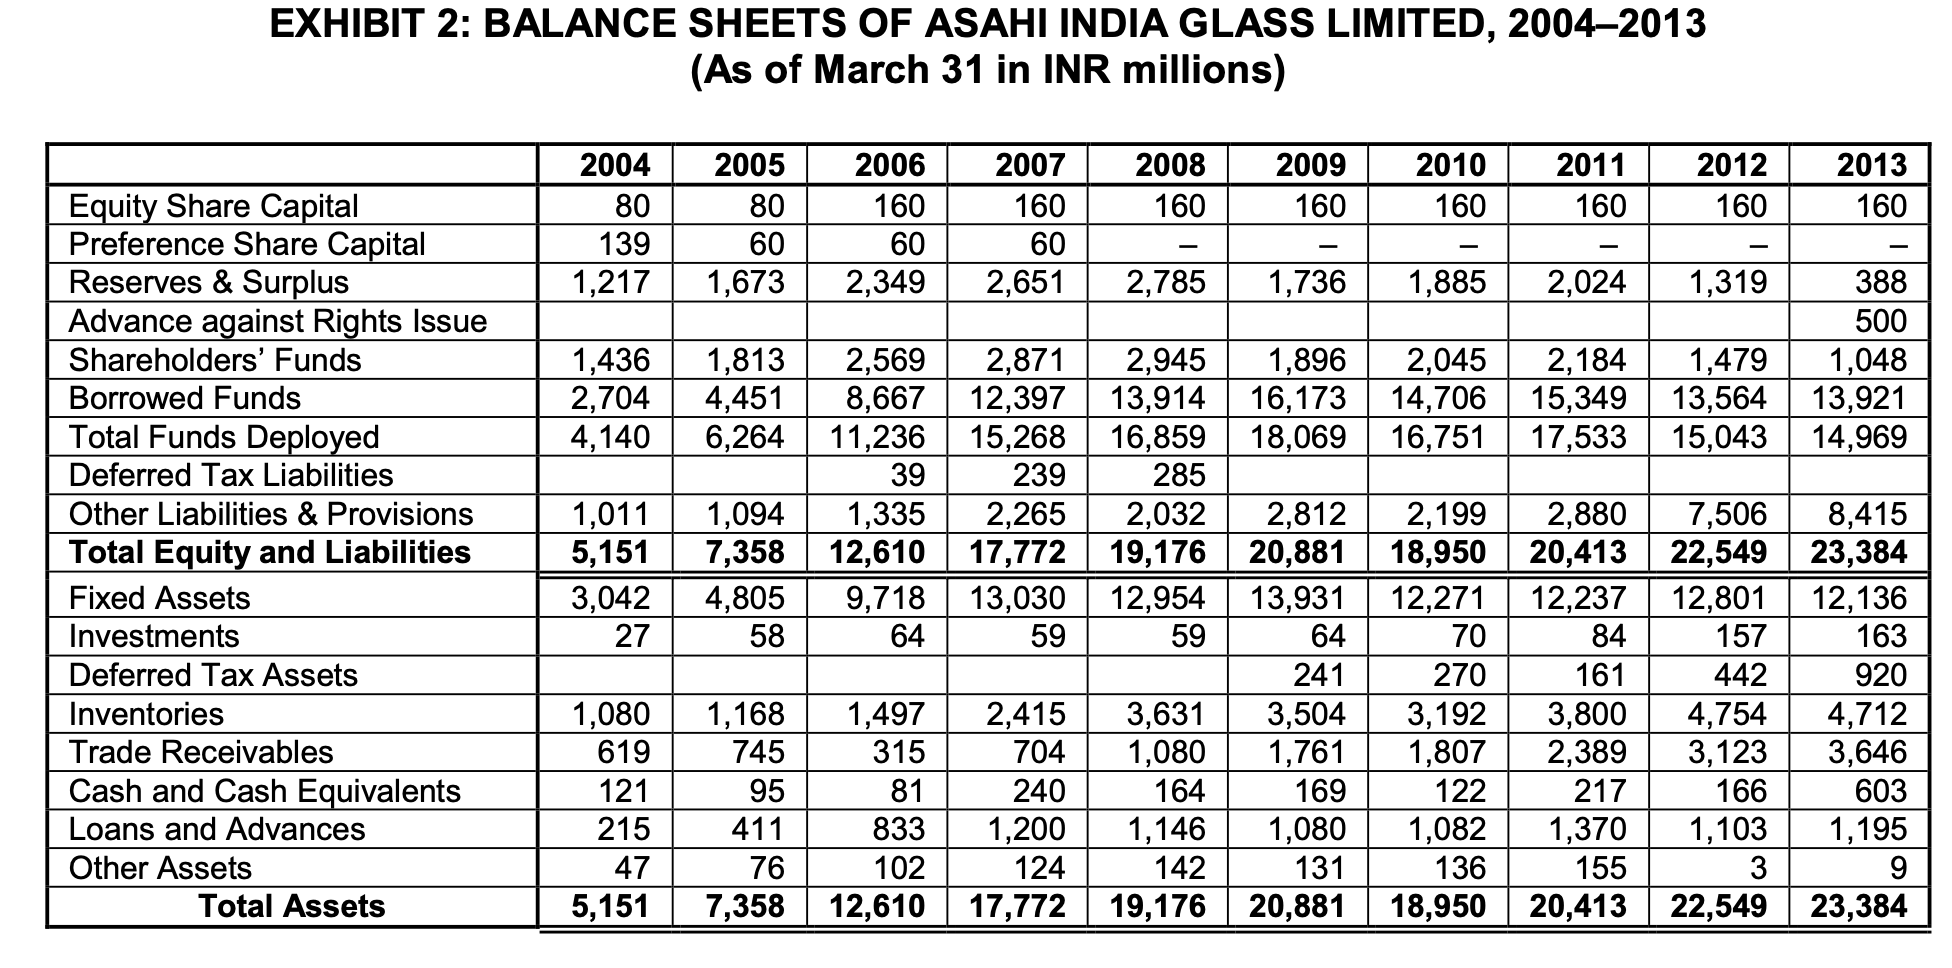
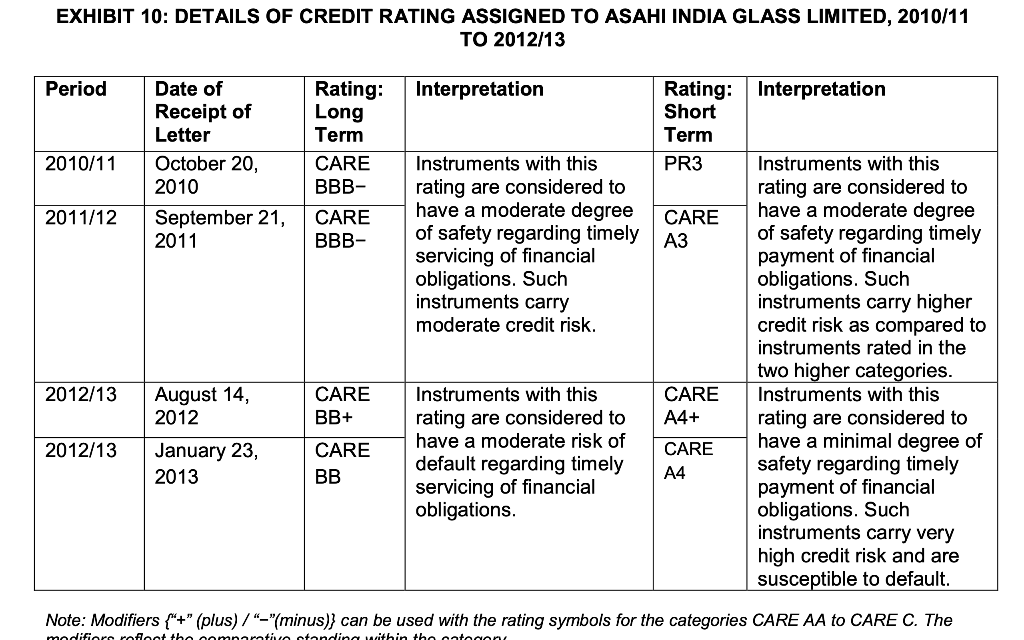
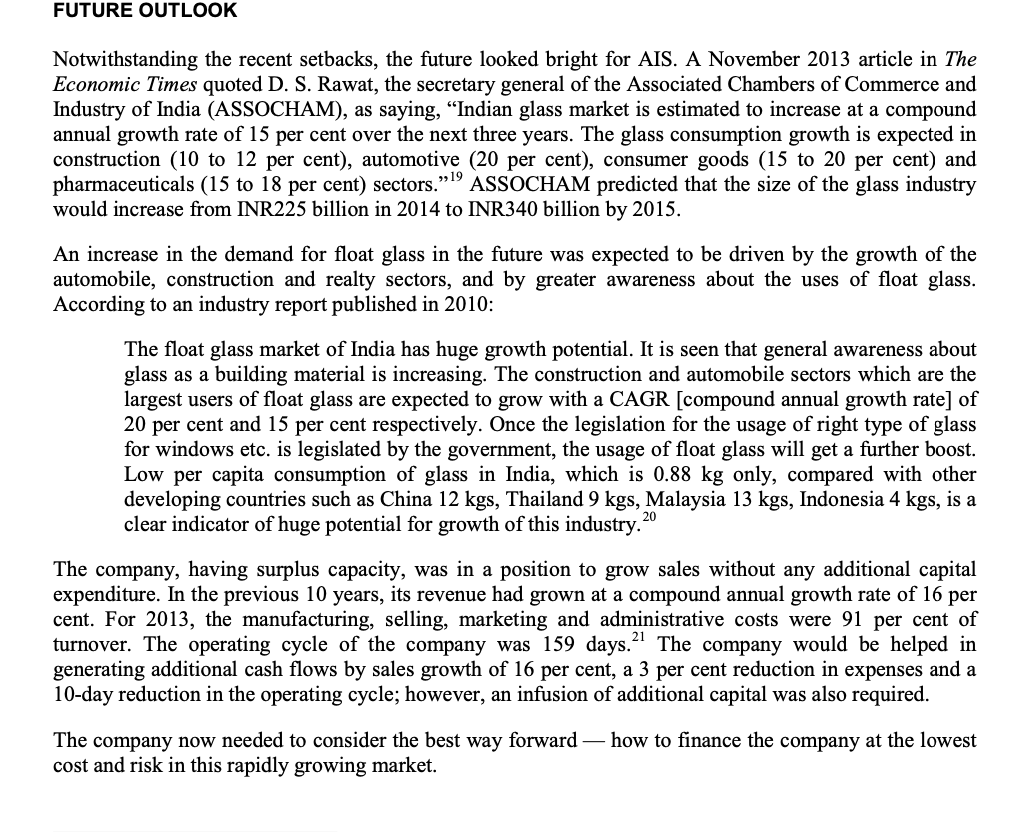
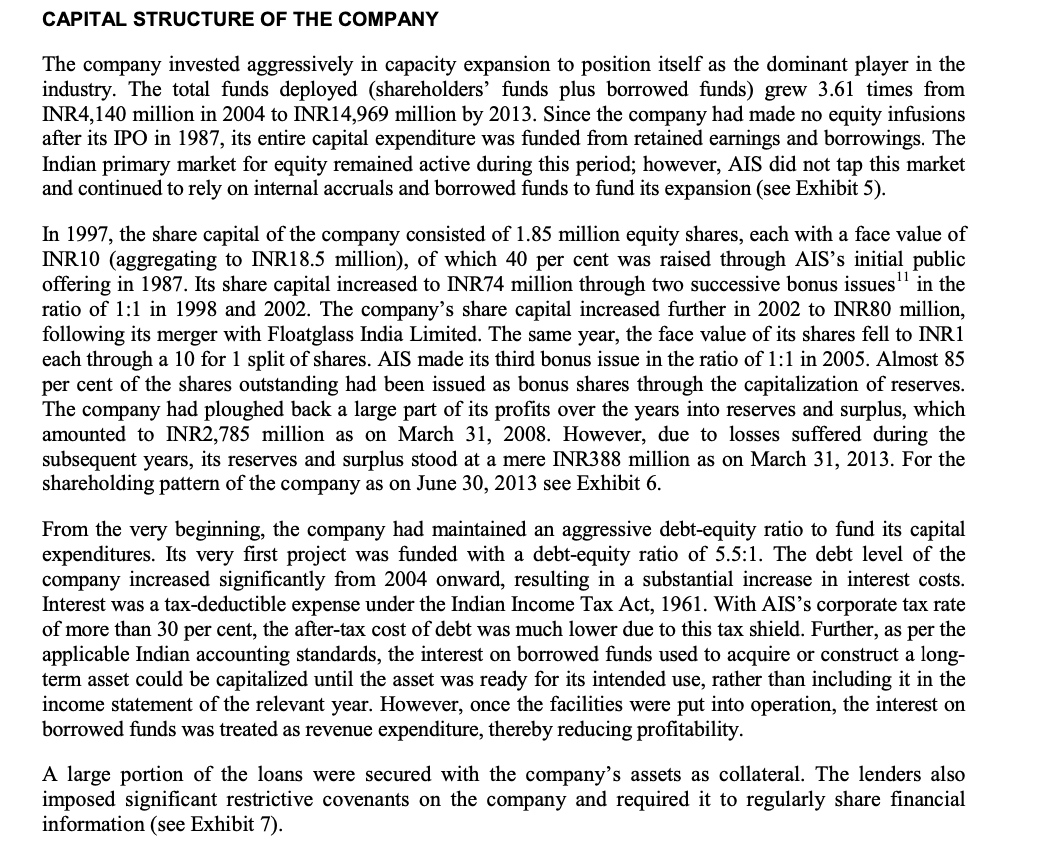
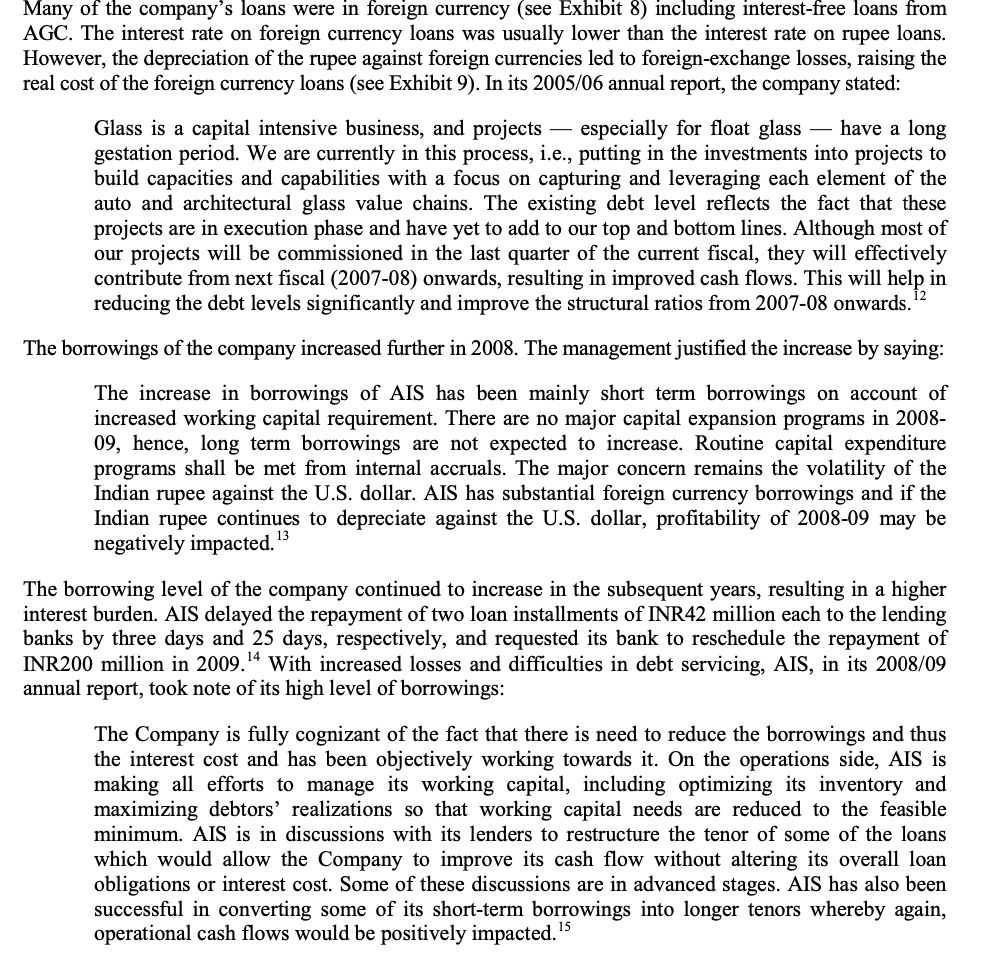
- What do you make of the present capital structure?
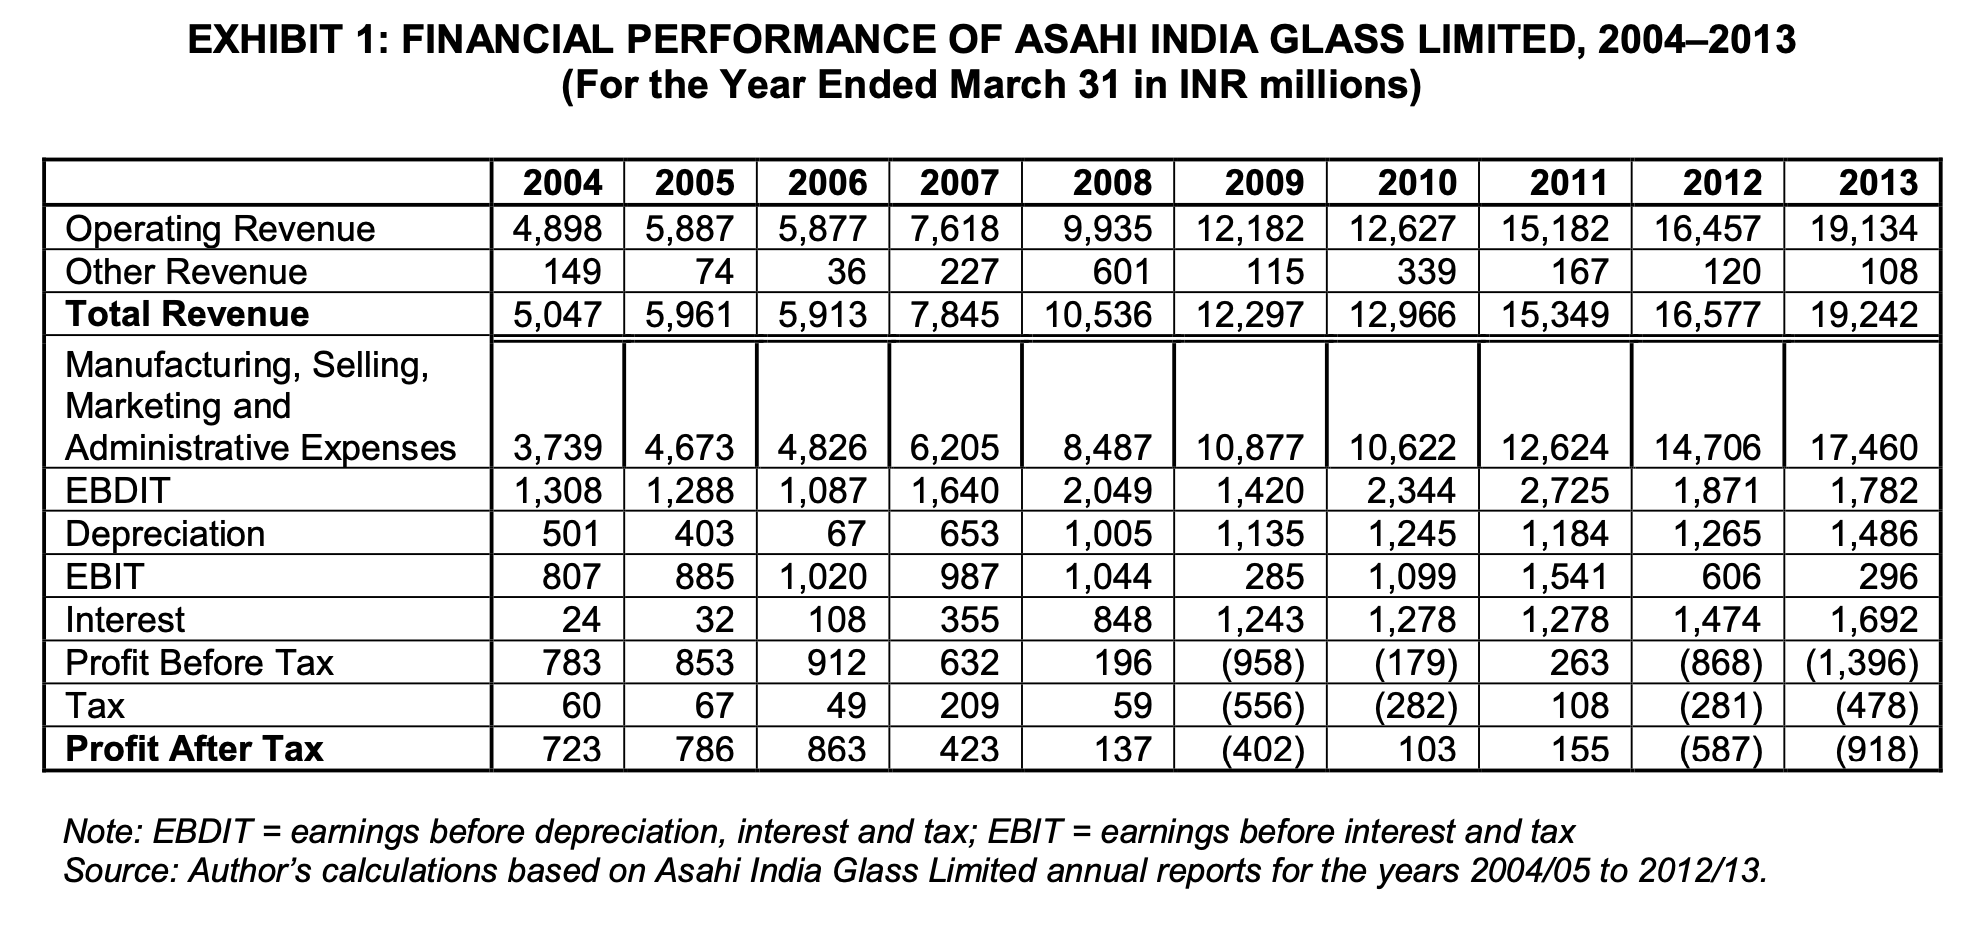
- What do you make of financial and operating results, including margins?
-
- What has been happening over time? To margins? To ratios? To EBITDA? How good has been the underlying business?
-
- What has been the order of financing followed by AIS over time? What do you see? What is the pattern? What have been the sources used? Where have funds been used? How well has interest been covered? Show the pattern for a suitable number of years and periods.
- Why did AIS choose a rights issue to deleverage?
-
- In what state is the company now? What options are open to AIS management?
- Project financial statements (revenues, profits and cash flows) for 2014
- How concerned will lenders be?
- What are the difficulties of deleveraging?
- What actions would you recommend?
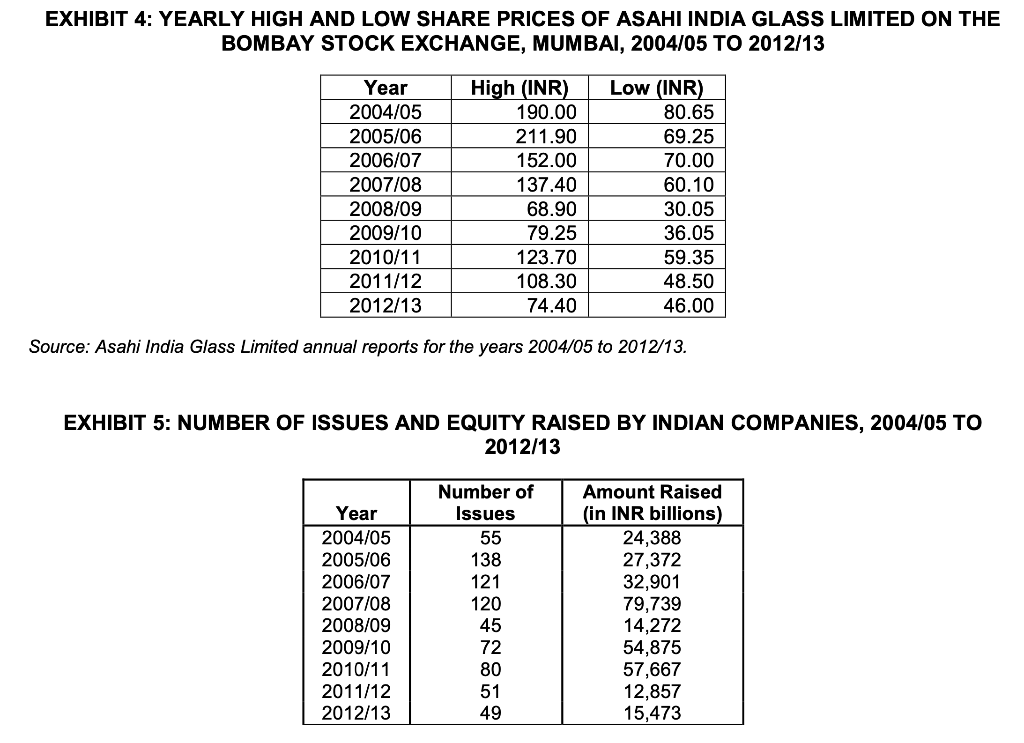
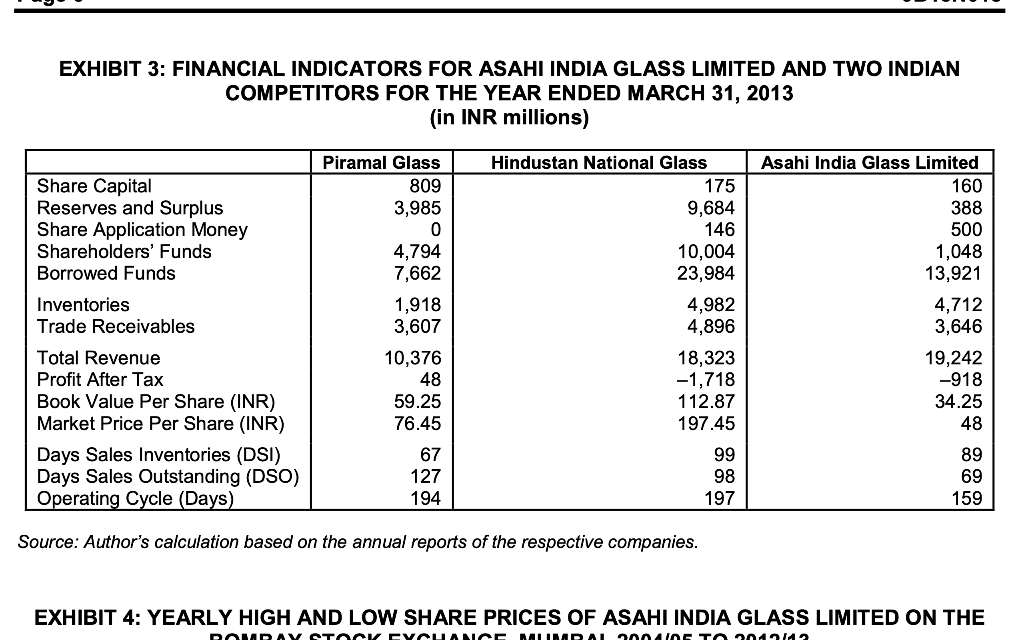
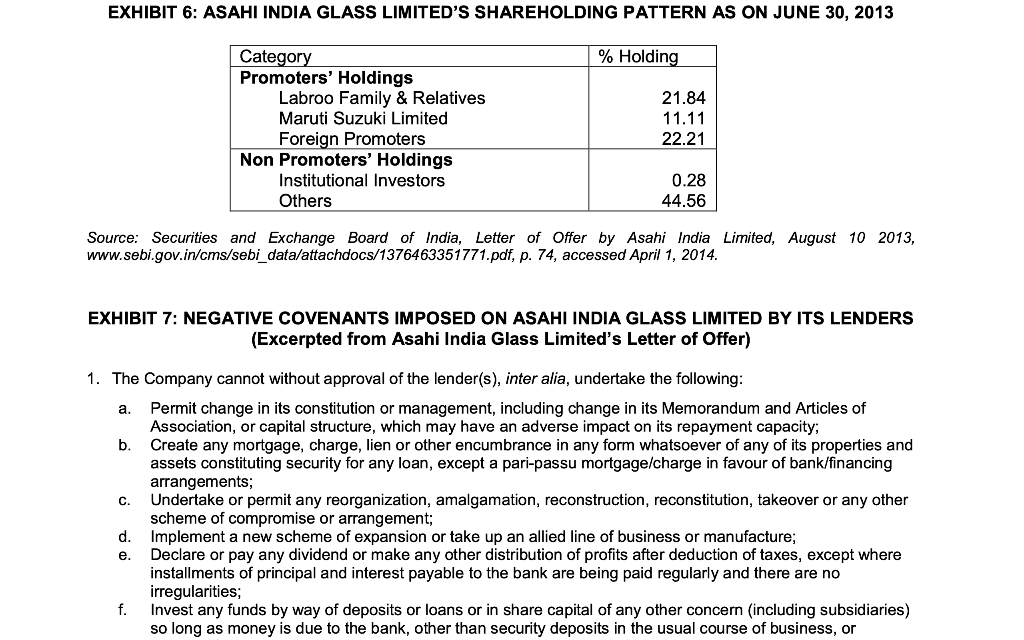
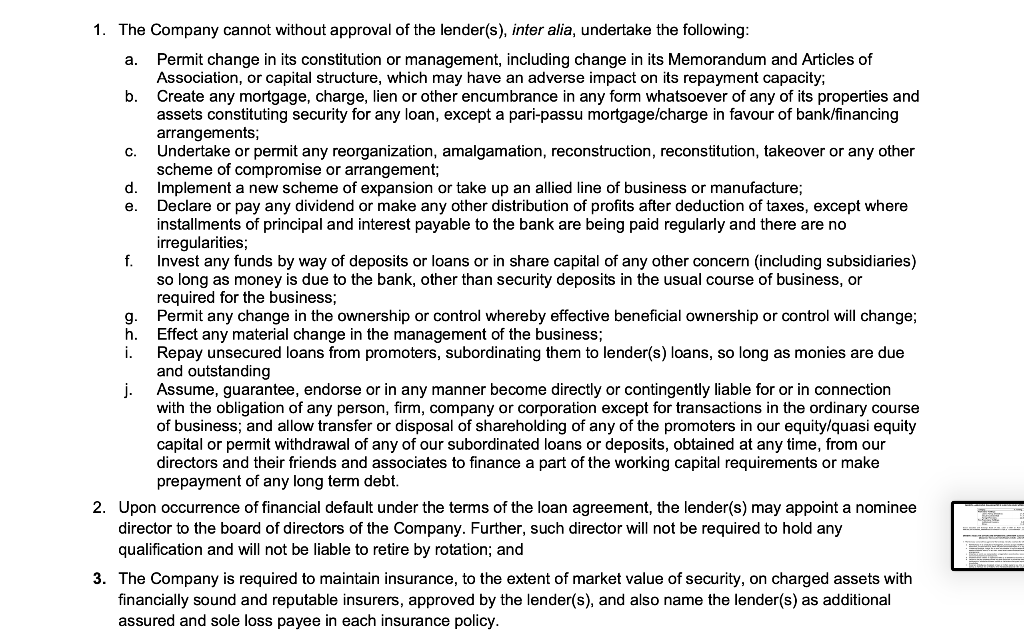
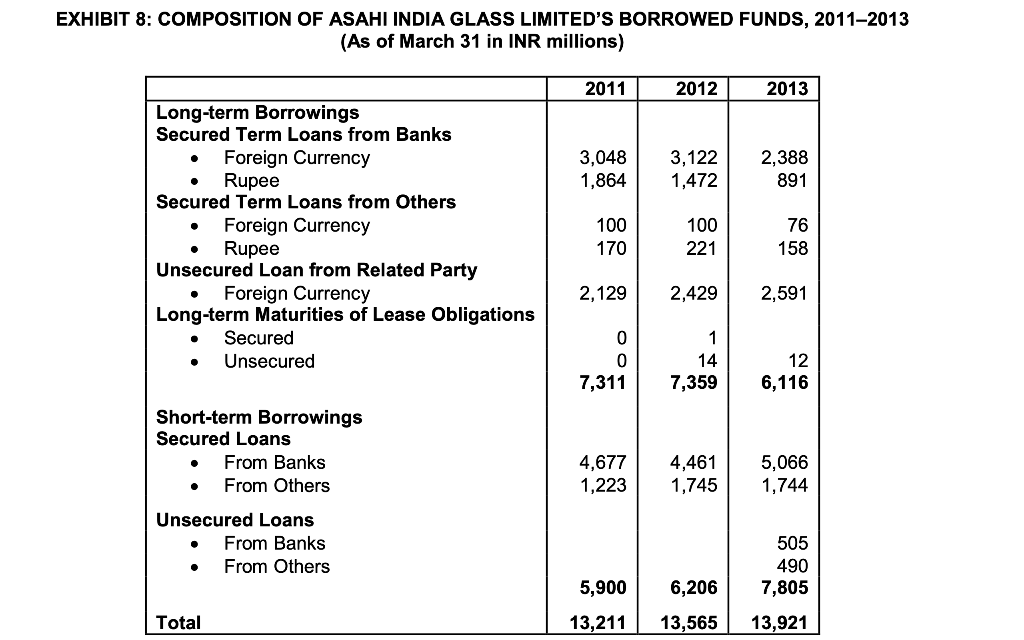
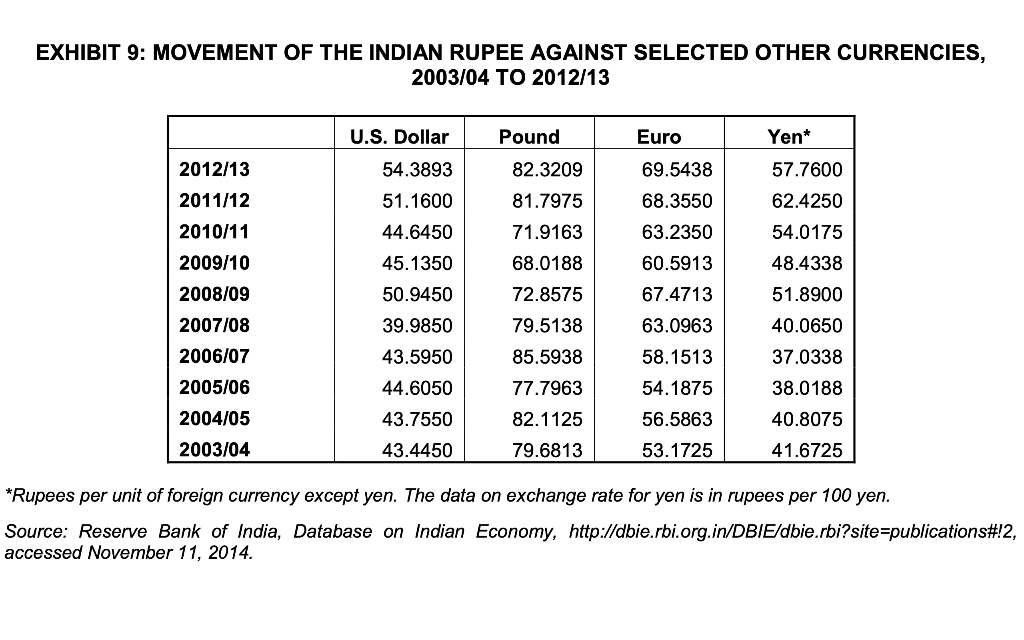
EXHIBIT 1: FINANCIAL PERFORMANCE OF ASAHI INDIA GLASS LIMITED, 20042013 (For the Year Ended March 31 in INR millions) 2004 4,898 149 5,047 2005 2006 2007 5,887 5,877 | 7,618 74 36 227 5,961 5,913 7,845 2008 2009 9,935 | 12,182 601 | 115 10,536 12,297 2010 12,627 339 12,966 2011 15,182 167 15,349 2012 16,457 120 16,577 2013 19,134 108 19,242 | Operating Revenue Other Revenue Total Revenue Manufacturing, Selling, Marketing and Administrative Expenses EBDIT Depreciation | EBIT Interest | Profit Before Tax 3,739 4,673 4,826 1,308 1,288 1,087 | 501 403 67 807 885 1.020 24 32 1 08 783 | 853 912 60 67 49 723 786 | 863 6,205 1,640 653 987 355 632 209 423 | 8,487 10,877 2,049 1,420 1,005 1,135 1.044 285 848 1,243 196 (958)| 59 (556) 137 (402) 10,622 2,344 1,245 1.099 1,278 (179) | (282) 103 12,624 2,725 1,184 1.541 1,278 263 108 155 14,706 17,460 1,871 1,782 1,265 1,486 606 296 1,474 1,692 (868) | (1,396) (281) (478) | (587)| (918) | Tax Profit After Tax Note: EBDIT = earnings before depreciation, interest and tax; EBIT = earnings before interest and tax Source: Author's calculations based on Asahi India Glass Limited annual reports for the years 2004/05 to 2012/13. EXHIBIT 2: BALANCE SHEETS OF ASAHI INDIA GLASS LIMITED, 20042013 (As of March 31 in INR millions) | 2004 80 139 1,217 2005 80 60 1,673 2006 160 60 2,349 2007 160 60 2,651 2008 160 2009 160 2010 160 2011 160 2012 160 2013 | 160 2,785 1,736 1,885 2,024 1,319 1,436 2,704 4,140 1,813 4,451 6,264 1,896 16,173 18,069 2,045 14,706 16,751 2,184 15,349 17,533 1,479 13,564 15,043 388 500 1,048 13,921 14,969 Equity Share Capital | Preference Share Capital Reserves & Surplus Advance against Rights Issue | Shareholders' Funds Borrowed Funds | Total Funds Deployed Deferred Tax Liabilities Other Liabilities & Provisions | Total Equity and Liabilities Fixed Assets Investments | Deferred Tax Assets Inventories Trade Receivables | Cash and Cash Equivalents | Loans and Advances Other Assets Total Assets 2,871 12,397 15,268 239 2,265 17,772 13,030 59 2,569 8,667 11,236 39 1,335 12,610 9,718 64 2,945 13,914 16,859 285 2,032 19,176 12,954 59 1,011 | 5,151 3,042 27 1,094 7,358 4,805 58 1,080 619 121 215 47 5,151 1,168 745 95 411 76 7,358 1,4972,415 315 704 81 2 40 833 1,200 102 124 12,610 17,772 3,631 1,080 164 1,146 142 19,176 2,812 2,199 2,880 7,506 8,415 20,881 18,950 20,413 22,549 | 23,384 13,931 | 12,271 12,237 | 12,801 12,136 64 70 1 84 157 163 241 270 161 - 442 920 3,504 3,1923,800 4,754 4,712 1,761 1,807 2,389 3,123 | 3,646 | 169 122 217 166 603 1,080 1,082 1,370 1,103 1,195 131 136 155 3 9 20,881 18,950 20,413 22,549 23,384 Total Assets EXHIBIT 4: YEARLY HIGH AND LOW SHARE PRICES OF ASAHI INDIA GLASS LIMITED ON THE BOMBAY STOCK EXCHANGE, MUMBAI, 2004/05 TO 2012/13 Year 2004/05 2005/06 2006/07 2007/08 2008/09 2009/10 2010/11 2011/12 2012/13 High (INR) 190.00 211.90 152.00 137.40 68.90 79.25 123.70 108.30 74.40 Low (INR) 80.65 69.25 70.00 60.10 30.05 36.05 59.35 48.50 46.00 Source: Asahi India Glass Limited annual reports for the years 2004/05 to 2012/13. EXHIBIT 5: NUMBER OF ISSUES AND EQUITY RAISED BY INDIAN COMPANIES, 2004/05 TO 2012/13 Number of Issues 55 Year 2004/05 2005/06 2006/07 2007/08 2008/09 2009/10 2010/11 2011/12 2012/13 138 121 120 Amount Raised (in INR billions) 24,388 27,372 32,901 79,739 14,272 54,875 57,667 12,857 15,473 45 EXHIBIT 3: FINANCIAL INDICATORS FOR ASAHI INDIA GLASS LIMITED AND TWO INDIAN COMPETITORS FOR THE YEAR ENDED MARCH 31, 2013 (in INR millions) Piramal Glass 809 3,985 Share Capital Reserves and Surplus Share Application Money Shareholders' Funds Borrowed Funds Inventories Trade Receivables Total Revenue Profit After Tax Book Value Per Share (INR) Market Price Per Share (INR) Days Sales Inventories (DSI) Days Sales Outstanding (DSO) Operating Cycle (Days) 4,794 7,662 1,918 3,607 10,376 Hindustan National Glass 175 9,684 146 10,004 23,984 4,982 4,896 18,323 -1,718 112.87 197.45 Asahi India Glass Limited 160 388 500 1,048 13,921 4,712 3,646 19,242 -918 34.25 48 59.25 76.45 48 67 99 89 127 194 98 197 69 159 Source: Author's calculation based on the annual reports of the respective companies. EXHIBIT 4: YEARLY HIGH AND LOW SHARE PRICES OF ASAHI INDIA GLASS LIMITED ON THE DODAVCTO YOUAN MURAL ETO 2012 EXHIBIT 6: ASAHI INDIA GLASS LIMITED'S SHAREHOLDING PATTERN AS ON JUNE 30, 2013 % Holding Category Promoters' Holdings Labroo Family & Relatives Maruti Suzuki Limited Foreign Promoters Non Promoters' Holdings Institutional Investors Others 21.84 11.11 22.21 0.28 44.56 Source: Securities and Exchange Board of India, Letter of Offer by Asahi India Limited, August 10 2013, www.sebi.gov.in/cms/sebi_data/attachdocs/1376463351771.pdf, p. 74, accessed April 1, 2014. EXHIBIT 7: NEGATIVE COVENANTS IMPOSED ON ASAHI INDIA GLASS LIMITED BY ITS LENDERS (Excerpted from Asahi India Glass Limited's Letter of Offer) a. Perm 1. The Company cannot without approval of the lender(s), inter alia, undertake the following: Permit change in its constitution or management, including change in its Memorandum and Articles of Association, or capital structure, which may have an adverse impact on its repayment capacity; Create any mortgage, charge, lien or other encumbrance in any form whatsoever of any of its properties and assets constituting security for any loan, except a pari-passu mortgage/charge in favour of bank/financing arrangements; c. Undertake or permit any reorganization, amalgamation, reconstruction, reconstitution, takeover or any other scheme of compromise or arrangement; d. Implement a new scheme of expansion or take up an allied line of business or manufacture; e. Declare or pay any dividend or make any other distribution of profits after deduction of taxes, except where installments of principal and interest payable to the bank are being paid regularly and there are no irregularities; f. Invest any funds by way of deposits or loans or in share capital of any other concern (including subsidiaries) so long as money is due to the bank, other than security deposits in the usual course of business, or 1. The Company cannot without approval of the lender(s), inter alia, undertake the following: a. Permit change in its constitution or management, including change in its Memorandum and Articles of Association, or capital structure, which may have an adverse impact on its repayment capacity; b. Create any mortgage, charge, lien or other encumbrance in any form whatsoever of any of its properties and assets constituting security for any loan, except a pari-passu mortgage/charge in favour of bank/financing arrangements; Undertake or permit any reorganization, amalgamation, reconstruction, reconstitution, takeover or any other scheme of compromise or arrangement; Implement a new scheme of expansion or take up an allied line of business or manufacture; Declare or pay any dividend or make any other distribution of profits after deduction of taxes, except where installments of principal and interest payable to the bank are being paid regularly and there are no irregularities; Invest any funds by way of deposits or loans or in share capital of any other concern (including subsidiaries) so long as money is due to the bank, other than security deposits in the usual course of business, or required for the business; Permit any change in the ownership or control whereby effective beneficial ownership or control will change; h. Effect any material change in the management of the business; Repay unsecured loans from promoters, subordinating them to lender(s) loans, so long as monies are due and outstanding Assume, guarantee, endorse or in any manner become directly or contingently liable for or in connection with the obligation of any person, firm, company or corporation except for transactions in the ordinary course of business; and allow transfer or disposal of shareholding of any of the promoters in our equity/quasi equity capital or permit withdrawal of any of our subordinated loans or deposits, obtained at any time, from our directors and their friends and associates to finance a part of the working capital requirements or make prepayment of any long term debt. 2. Upon occurrence of financial default under the terms of the loan agreement, the lender(s) may appoint a nominee director to the board of directors of the Company. Further, such director will not be required to hold any qualification and will not be liable to retire by rotation; and 3. The Company is required to maintain insurance, to the extent of market value of security, on charged assets with financially sound and reputable insurers, approved by the lender(s), and also name the lender(s) as additional assured and sole loss payee in each insurance policy. EXHIBIT 8: COMPOSITION OF ASAHI INDIA GLASS LIMITED'S BORROWED FUNDS, 2011-2013 (As of March 31 in INR millions) 2011 2012 2013 3,048 1,864 3,122 1,472 2,388 891 100 Long-term Borrowings Secured Term Loans from Banks Foreign Currency Rupee Secured Term Loans from Others Foreign Currency Rupee Unsecured Loan from Related Party Foreign Currency Long-term Maturities of Lease Obligations Secured . Unsecured 100 170 76 158 221 2,129 2,429 2,591 12 7,311 14 7,359 6,116 Short-term Borrowings Secured Loans From Banks From Others Unsecured Loans From Banks From Others 4,677 1,223 4,461 1,745 5,066 1,744 5,900 13,211 6,206 13,565 505 490 7,805 13,921 Total EXHIBIT 9: MOVEMENT OF THE INDIAN RUPEE AGAINST SELECTED OTHER CURRENCIES, 2003/04 TO 2012/13 Pound Yen* 2012/13 2011/12 2010/11 2009/10 2008/09 2007/08 2006/07 2005/06 2004/05 2003/04 U.S. Dollar 54.3893 51.1600 44.6450 45.1350 50.9450 39.9850 43.5950 44.6050 43.7550 43.4450 82.3209 81.7975 71.9163 68.0188 72.8575 79.5138 85.5938 77.7963 82.1125 79.6813 Euro 69.5438 68.3550 63.2350 60.5913 67.4713 63.0963 58.1513 54.1875 56.5863 53.1725 57.7600 62.4250 54.0175 48.4338 51.8900 40.0650 37.0338 38.0188 40.8075 41.6725 *Rupees per unit of foreign currency except yen. The data on exchange rate for yen is in rupees per 100 yen. Source: Reserve Bank of India, Database on Indian Economy, http://dbie.rbi.org.in/DBIE/dbie.rbi?site=publications#!2, accessed November 11, 2014. EXHIBIT 10: DETAILS OF CREDIT RATING ASSIGNED TO ASAHI INDIA GLASS LIMITED, 2010/11 TO 2012/13 Period Rating: Interpretation Interpretation Long Date of Receipt of Letter October 20, 2010 September 21, 2011 Rating: Short Term PR3 2010/11 Term CARE BBB- CARE BBB- 2011/12 CARE Instruments with this rating are considered to have a moderate degree of safety regarding timely servicing of financial obligations. Such instruments carry moderate credit risk. A3 Instruments with this rating are considered to have a moderate degree of safety regarding timely payment of financial obligations. Such instruments carry higher credit risk as compared to instruments rated in the two higher categories. Instruments with this rating are considered to have a minimal degree of safety regarding timely payment of financial obligations. Such instruments carry very high credit risk and are susceptible to default. 2012/13 August 14, 2012 CARE BB+ CARE BB CARE A4+ CARE 2012/13 Instruments with this rating are considered to have a moderate risk of default regarding timely servicing of financial obligations. January 23, 2013 Note: Modifiers {"+" (plus) /"-"(minus)} can be used with the rating symbols for the categories CARE A to CARE C. The modifiororofloat thoamnarativtanding within the antago FUTURE OUTLOOK Notwithstanding the recent setbacks, the future looked bright for AIS. A November 2013 article in The Economic Times quoted D. S. Rawat, the secretary general of the Associated Chambers of Commerce and Industry of India (ASSOCHAM), as saying, "Indian glass market is estimated to increase at a compound annual growth rate of 15 per cent over the next three years. The glass consumption growth is expected in construction (10 to 12 per cent), automotive (20 per cent), consumer goods (15 to 20 per cent) and pharmaceuticals (15 to 18 per cent) sectors."19 ASSOCHAM predicted that the size of the glass industry would increase from INR225 billion in 2014 to INR340 billion by 2015. An increase in the demand for float glass in the future was expected to be driven by the growth of the automobile, construction and realty sectors, and by greater awareness about the uses of float glass. According to an industry report published in 2010: The float glass market of India has huge growth potential. It is seen that general awareness about glass as a building material is increasing. The construction and automobile sectors which are the largest users of float glass are expected to grow with a CAGR [compound annual growth rate] of 20 per cent and 15 per cent respectively. Once the legislation for the usage of right type of glass for windows etc. is legislated by the government, the usage of float glass will get a further boost. Low per capita consumption of glass in India, which is 0.88 kg only, compared with other developing countries such as China 12 kgs, Thailand 9 kgs, Malaysia 13 kgs, Indonesia 4 kgs, is a clear indicator of huge potential for growth of this industry.20 The company, having surplus capacity, was in a position to grow sales without any additional capital expenditure. In the previous 10 years, its revenue had grown at a compound annual growth rate of 16 per cent. For 2013, the manufacturing, selling, marketing and administrative costs were 91 per cent of turnover. The operating cycle of the company was 159 days.21 The company would be helped in generating additional cash flows by sales growth of 16 per cent, a 3 per cent reduction in expenses and a 10-day reduction in the operating cycle; however, an infusion of additional capital was also required. The company now needed to consider the best way forward how to finance the company at the lowest cost and risk in this rapidly growing market. CAPITAL STRUCTURE OF THE COMPANY The company invested aggressively in capacity expansion to position itself as the dominant player in the industry. The total funds deployed (shareholders' funds plus borrowed funds) grew 3.61 times from INR4,140 million in 2004 to INR14,969 million by 2013. Since the company had made no equity infusions after its IPO in 1987, its entire capital expenditure was funded from retained earnings and borrowings. The Indian primary market for equity remained active during this period; however, AIS did not tap this market and continued to rely on internal accruals and borrowed funds to fund its expansion (see Exhibit 5). In 1997, the share capital of the company consisted of 1.85 million equity shares, each with a face value of INR10 (aggregating to INR18.5 million), of which 40 per cent was raised through AIS's initial public offering in 1987. Its share capital increased to INR74 million through two successive bonus issues in the ratio of 1:1 in 1998 and 2002. The company's share capital increased further in 2002 to INR80 million, following its merger with Floatglass India Limited. The same year, the face value of its shares fell to INR1 each through a 10 for 1 split of shares. AIS made its third bonus issue in the ratio of 1:1 in 2005. Almost 85 per cent of the shares outstanding had been issued as bonus shares through the capitalization of reserves. The company had ploughed back a large part of its profits over the years into reserves and surplus, which amounted to INR2,785 million as on March 31, 2008. However, due to losses suffered during the subsequent years, its reserves and surplus stood at a mere INR388 million as on March 31, 2013. For the shareholding pattern of the company as on June 30, 2013 see Exhibit 6. From the very beginning, the company had maintained an aggressive debt-equity ratio to fund its capital expenditures. Its very first project was funded with a debt-equity ratio of 5.5:1. The debt level of the company increased significantly from 2004 onward, resulting in a substantial increase in interest costs. Interest was a tax-deductible expense under the Indian Income Tax Act, 1961. With AIS's corporate tax rate of more than 30 per cent, the after-tax cost of debt was much lower due to this tax shield. Further, as per the applicable Indian accounting standards, the interest on borrowed funds used to acquire or construct a long- term asset could be capitalized until the asset was ready for its intended use, rather than including it in the income statement of the relevant year. However, once the facilities were put into operation, the interest on borrowed funds was treated as revenue expenditure, thereby reducing profitability. A large portion of the loans were secured with the company's assets as collateral. The lenders also imposed significant restrictive covenants on the company and required it to regularly share financial information (see Exhibit 7). Many of the company's loans were in foreign currency (see Exhibit 8) including interest-free loans from AGC. The interest rate on foreign currency loans was usually lower than the interest rate on rupee loans. However, the depreciation of the rupee against foreign currencies led to foreign-exchange losses, raising the real cost of the foreign currency loans (see Exhibit 9). In its 2005/06 annual report, the company stated: Glass is a capital intensive business, and projects especially for float glass have a long gestation period. We are currently in this process, i.e., putting in the investments into projects to build capacities and capabilities with a focus on capturing and leveraging each element of the auto and architectural glass value chains. The existing debt level reflects the fact that these projects are in execution phase and have yet to add to our top and bottom lines. Although most of our projects will be commissioned in the last quarter of the current fiscal, they will effectively contribute from next fiscal (2007-08) onwards, resulting in improved cash flows. This will help in reducing the debt levels significantly and improve the structural ratios from 2007-08 onwards. The borrowings of the company increased further in 2008. The management justified the increase by saying: The increase in borrowings of AIS has been mainly short term borrowings on account of increased working capital requirement. There are no major capital expansion programs in 2008- 09, hence, long term borrowings are not expected to increase. Routine capital expenditure programs shall be met from internal accruals. The major concern remains the volatility of the Indian rupee against the U.S. dollar. AIS has substantial foreign currency borrowings and if the Indian rupee continues to depreciate against the U.S. dollar, profitability of 2008-09 may be negatively impacted. 13 The borrowing level of the company continued to increase in the subsequent years, resulting in a higher interest burden. AIS delayed the repayment of two loan installments of INR42 million each to the lending banks by three days and 25 days, respectively, and requested its bank to reschedule the repayment of INR200 million in 2009. With increased losses and difficulties in debt servicing, AIS, in its 2008/09 annual report, took note of its high level of borrowings: The Company is fully cognizant of the fact that there is need to reduce the borrowings and thus the interest cost and has been objectively working towards it. On the operations side, AIS is making all efforts to manage its working capital, including optimizing its inventory and maximizing debtors' realizations so that working capital needs are reduced to the feasible minimum. AIS is in discussions with its lenders to restructure the tenor of some of the loans which would allow the Company to improve its cash flow without altering its overall loan obligations or interest cost. Some of these discussions are in advanced stages. AIS has also been successful in converting some of its short-term borrowings into longer tenors whereby again, operational cash flows would be positively impacted." EXHIBIT 1: FINANCIAL PERFORMANCE OF ASAHI INDIA GLASS LIMITED, 20042013 (For the Year Ended March 31 in INR millions) 2004 4,898 149 5,047 2005 2006 2007 5,887 5,877 | 7,618 74 36 227 5,961 5,913 7,845 2008 2009 9,935 | 12,182 601 | 115 10,536 12,297 2010 12,627 339 12,966 2011 15,182 167 15,349 2012 16,457 120 16,577 2013 19,134 108 19,242 | Operating Revenue Other Revenue Total Revenue Manufacturing, Selling, Marketing and Administrative Expenses EBDIT Depreciation | EBIT Interest | Profit Before Tax 3,739 4,673 4,826 1,308 1,288 1,087 | 501 403 67 807 885 1.020 24 32 1 08 783 | 853 912 60 67 49 723 786 | 863 6,205 1,640 653 987 355 632 209 423 | 8,487 10,877 2,049 1,420 1,005 1,135 1.044 285 848 1,243 196 (958)| 59 (556) 137 (402) 10,622 2,344 1,245 1.099 1,278 (179) | (282) 103 12,624 2,725 1,184 1.541 1,278 263 108 155 14,706 17,460 1,871 1,782 1,265 1,486 606 296 1,474 1,692 (868) | (1,396) (281) (478) | (587)| (918) | Tax Profit After Tax Note: EBDIT = earnings before depreciation, interest and tax; EBIT = earnings before interest and tax Source: Author's calculations based on Asahi India Glass Limited annual reports for the years 2004/05 to 2012/13. EXHIBIT 2: BALANCE SHEETS OF ASAHI INDIA GLASS LIMITED, 20042013 (As of March 31 in INR millions) | 2004 80 139 1,217 2005 80 60 1,673 2006 160 60 2,349 2007 160 60 2,651 2008 160 2009 160 2010 160 2011 160 2012 160 2013 | 160 2,785 1,736 1,885 2,024 1,319 1,436 2,704 4,140 1,813 4,451 6,264 1,896 16,173 18,069 2,045 14,706 16,751 2,184 15,349 17,533 1,479 13,564 15,043 388 500 1,048 13,921 14,969 Equity Share Capital | Preference Share Capital Reserves & Surplus Advance against Rights Issue | Shareholders' Funds Borrowed Funds | Total Funds Deployed Deferred Tax Liabilities Other Liabilities & Provisions | Total Equity and Liabilities Fixed Assets Investments | Deferred Tax Assets Inventories Trade Receivables | Cash and Cash Equivalents | Loans and Advances Other Assets Total Assets 2,871 12,397 15,268 239 2,265 17,772 13,030 59 2,569 8,667 11,236 39 1,335 12,610 9,718 64 2,945 13,914 16,859 285 2,032 19,176 12,954 59 1,011 | 5,151 3,042 27 1,094 7,358 4,805 58 1,080 619 121 215 47 5,151 1,168 745 95 411 76 7,358 1,4972,415 315 704 81 2 40 833 1,200 102 124 12,610 17,772 3,631 1,080 164 1,146 142 19,176 2,812 2,199 2,880 7,506 8,415 20,881 18,950 20,413 22,549 | 23,384 13,931 | 12,271 12,237 | 12,801 12,136 64 70 1 84 157 163 241 270 161 - 442 920 3,504 3,1923,800 4,754 4,712 1,761 1,807 2,389 3,123 | 3,646 | 169 122 217 166 603 1,080 1,082 1,370 1,103 1,195 131 136 155 3 9 20,881 18,950 20,413 22,549 23,384 Total Assets EXHIBIT 4: YEARLY HIGH AND LOW SHARE PRICES OF ASAHI INDIA GLASS LIMITED ON THE BOMBAY STOCK EXCHANGE, MUMBAI, 2004/05 TO 2012/13 Year 2004/05 2005/06 2006/07 2007/08 2008/09 2009/10 2010/11 2011/12 2012/13 High (INR) 190.00 211.90 152.00 137.40 68.90 79.25 123.70 108.30 74.40 Low (INR) 80.65 69.25 70.00 60.10 30.05 36.05 59.35 48.50 46.00 Source: Asahi India Glass Limited annual reports for the years 2004/05 to 2012/13. EXHIBIT 5: NUMBER OF ISSUES AND EQUITY RAISED BY INDIAN COMPANIES, 2004/05 TO 2012/13 Number of Issues 55 Year 2004/05 2005/06 2006/07 2007/08 2008/09 2009/10 2010/11 2011/12 2012/13 138 121 120 Amount Raised (in INR billions) 24,388 27,372 32,901 79,739 14,272 54,875 57,667 12,857 15,473 45 EXHIBIT 3: FINANCIAL INDICATORS FOR ASAHI INDIA GLASS LIMITED AND TWO INDIAN COMPETITORS FOR THE YEAR ENDED MARCH 31, 2013 (in INR millions) Piramal Glass 809 3,985 Share Capital Reserves and Surplus Share Application Money Shareholders' Funds Borrowed Funds Inventories Trade Receivables Total Revenue Profit After Tax Book Value Per Share (INR) Market Price Per Share (INR) Days Sales Inventories (DSI) Days Sales Outstanding (DSO) Operating Cycle (Days) 4,794 7,662 1,918 3,607 10,376 Hindustan National Glass 175 9,684 146 10,004 23,984 4,982 4,896 18,323 -1,718 112.87 197.45 Asahi India Glass Limited 160 388 500 1,048 13,921 4,712 3,646 19,242 -918 34.25 48 59.25 76.45 48 67 99 89 127 194 98 197 69 159 Source: Author's calculation based on the annual reports of the respective companies. EXHIBIT 4: YEARLY HIGH AND LOW SHARE PRICES OF ASAHI INDIA GLASS LIMITED ON THE DODAVCTO YOUAN MURAL ETO 2012 EXHIBIT 6: ASAHI INDIA GLASS LIMITED'S SHAREHOLDING PATTERN AS ON JUNE 30, 2013 % Holding Category Promoters' Holdings Labroo Family & Relatives Maruti Suzuki Limited Foreign Promoters Non Promoters' Holdings Institutional Investors Others 21.84 11.11 22.21 0.28 44.56 Source: Securities and Exchange Board of India, Letter of Offer by Asahi India Limited, August 10 2013, www.sebi.gov.in/cms/sebi_data/attachdocs/1376463351771.pdf, p. 74, accessed April 1, 2014. EXHIBIT 7: NEGATIVE COVENANTS IMPOSED ON ASAHI INDIA GLASS LIMITED BY ITS LENDERS (Excerpted from Asahi India Glass Limited's Letter of Offer) a. Perm 1. The Company cannot without approval of the lender(s), inter alia, undertake the following: Permit change in its constitution or management, including change in its Memorandum and Articles of Association, or capital structure, which may have an adverse impact on its repayment capacity; Create any mortgage, charge, lien or other encumbrance in any form whatsoever of any of its properties and assets constituting security for any loan, except a pari-passu mortgage/charge in favour of bank/financing arrangements; c. Undertake or permit any reorganization, amalgamation, reconstruction, reconstitution, takeover or any other scheme of compromise or arrangement; d. Implement a new scheme of expansion or take up an allied line of business or manufacture; e. Declare or pay any dividend or make any other distribution of profits after deduction of taxes, except where installments of principal and interest payable to the bank are being paid regularly and there are no irregularities; f. Invest any funds by way of deposits or loans or in share capital of any other concern (including subsidiaries) so long as money is due to the bank, other than security deposits in the usual course of business, or 1. The Company cannot without approval of the lender(s), inter alia, undertake the following: a. Permit change in its constitution or management, including change in its Memorandum and Articles of Association, or capital structure, which may have an adverse impact on its repayment capacity; b. Create any mortgage, charge, lien or other encumbrance in any form whatsoever of any of its properties and assets constituting security for any loan, except a pari-passu mortgage/charge in favour of bank/financing arrangements; Undertake or permit any reorganization, amalgamation, reconstruction, reconstitution, takeover or any other scheme of compromise or arrangement; Implement a new scheme of expansion or take up an allied line of business or manufacture; Declare or pay any dividend or make any other distribution of profits after deduction of taxes, except where installments of principal and interest payable to the bank are being paid regularly and there are no irregularities; Invest any funds by way of deposits or loans or in share capital of any other concern (including subsidiaries) so long as money is due to the bank, other than security deposits in the usual course of business, or required for the business; Permit any change in the ownership or control whereby effective beneficial ownership or control will change; h. Effect any material change in the management of the business; Repay unsecured loans from promoters, subordinating them to lender(s) loans, so long as monies are due and outstanding Assume, guarantee, endorse or in any manner become directly or contingently liable for or in connection with the obligation of any person, firm, company or corporation except for transactions in the ordinary course of business; and allow transfer or disposal of shareholding of any of the promoters in our equity/quasi equity capital or permit withdrawal of any of our subordinated loans or deposits, obtained at any time, from our directors and their friends and associates to finance a part of the working capital requirements or make prepayment of any long term debt. 2. Upon occurrence of financial default under the terms of the loan agreement, the lender(s) may appoint a nominee director to the board of directors of the Company. Further, such director will not be required to hold any qualification and will not be liable to retire by rotation; and 3. The Company is required to maintain insurance, to the extent of market value of security, on charged assets with financially sound and reputable insurers, approved by the lender(s), and also name the lender(s) as additional assured and sole loss payee in each insurance policy. EXHIBIT 8: COMPOSITION OF ASAHI INDIA GLASS LIMITED'S BORROWED FUNDS, 2011-2013 (As of March 31 in INR millions) 2011 2012 2013 3,048 1,864 3,122 1,472 2,388 891 100 Long-term Borrowings Secured Term Loans from Banks Foreign Currency Rupee Secured Term Loans from Others Foreign Currency Rupee Unsecured Loan from Related Party Foreign Currency Long-term Maturities of Lease Obligations Secured . Unsecured 100 170 76 158 221 2,129 2,429 2,591 12 7,311 14 7,359 6,116 Short-term Borrowings Secured Loans From Banks From Others Unsecured Loans From Banks From Others 4,677 1,223 4,461 1,745 5,066 1,744 5,900 13,211 6,206 13,565 505 490 7,805 13,921 Total EXHIBIT 9: MOVEMENT OF THE INDIAN RUPEE AGAINST SELECTED OTHER CURRENCIES, 2003/04 TO 2012/13 Pound Yen* 2012/13 2011/12 2010/11 2009/10 2008/09 2007/08 2006/07 2005/06 2004/05 2003/04 U.S. Dollar 54.3893 51.1600 44.6450 45.1350 50.9450 39.9850 43.5950 44.6050 43.7550 43.4450 82.3209 81.7975 71.9163 68.0188 72.8575 79.5138 85.5938 77.7963 82.1125 79.6813 Euro 69.5438 68.3550 63.2350 60.5913 67.4713 63.0963 58.1513 54.1875 56.5863 53.1725 57.7600 62.4250 54.0175 48.4338 51.8900 40.0650 37.0338 38.0188 40.8075 41.6725 *Rupees per unit of foreign currency except yen. The data on exchange rate for yen is in rupees per 100 yen. Source: Reserve Bank of India, Database on Indian Economy, http://dbie.rbi.org.in/DBIE/dbie.rbi?site=publications#!2, accessed November 11, 2014. EXHIBIT 10: DETAILS OF CREDIT RATING ASSIGNED TO ASAHI INDIA GLASS LIMITED, 2010/11 TO 2012/13 Period Rating: Interpretation Interpretation Long Date of Receipt of Letter October 20, 2010 September 21, 2011 Rating: Short Term PR3 2010/11 Term CARE BBB- CARE BBB- 2011/12 CARE Instruments with this rating are considered to have a moderate degree of safety regarding timely servicing of financial obligations. Such instruments carry moderate credit risk. A3 Instruments with this rating are considered to have a moderate degree of safety regarding timely payment of financial obligations. Such instruments carry higher credit risk as compared to instruments rated in the two higher categories. Instruments with this rating are considered to have a minimal degree of safety regarding timely payment of financial obligations. Such instruments carry very high credit risk and are susceptible to default. 2012/13 August 14, 2012 CARE BB+ CARE BB CARE A4+ CARE 2012/13 Instruments with this rating are considered to have a moderate risk of default regarding timely servicing of financial obligations. January 23, 2013 Note: Modifiers {"+" (plus) /"-"(minus)} can be used with the rating symbols for the categories CARE A to CARE C. The modifiororofloat thoamnarativtanding within the antago FUTURE OUTLOOK Notwithstanding the recent setbacks, the future looked bright for AIS. A November 2013 article in The Economic Times quoted D. S. Rawat, the secretary general of the Associated Chambers of Commerce and Industry of India (ASSOCHAM), as saying, "Indian glass market is estimated to increase at a compound annual growth rate of 15 per cent over the next three years. The glass consumption growth is expected in construction (10 to 12 per cent), automotive (20 per cent), consumer goods (15 to 20 per cent) and pharmaceuticals (15 to 18 per cent) sectors."19 ASSOCHAM predicted that the size of the glass industry would increase from INR225 billion in 2014 to INR340 billion by 2015. An increase in the demand for float glass in the future was expected to be driven by the growth of the automobile, construction and realty sectors, and by greater awareness about the uses of float glass. According to an industry report published in 2010: The float glass market of India has huge growth potential. It is seen that general awareness about glass as a building material is increasing. The construction and automobile sectors which are the largest users of float glass are expected to grow with a CAGR [compound annual growth rate] of 20 per cent and 15 per cent respectively. Once the legislation for the usage of right type of glass for windows etc. is legislated by the government, the usage of float glass will get a further boost. Low per capita consumption of glass in India, which is 0.88 kg only, compared with other developing countries such as China 12 kgs, Thailand 9 kgs, Malaysia 13 kgs, Indonesia 4 kgs, is a clear indicator of huge potential for growth of this industry.20 The company, having surplus capacity, was in a position to grow sales without any additional capital expenditure. In the previous 10 years, its revenue had grown at a compound annual growth rate of 16 per cent. For 2013, the manufacturing, selling, marketing and administrative costs were 91 per cent of turnover. The operating cycle of the company was 159 days.21 The company would be helped in generating additional cash flows by sales growth of 16 per cent, a 3 per cent reduction in expenses and a 10-day reduction in the operating cycle; however, an infusion of additional capital was also required. The company now needed to consider the best way forward how to finance the company at the lowest cost and risk in this rapidly growing market. CAPITAL STRUCTURE OF THE COMPANY The company invested aggressively in capacity expansion to position itself as the dominant player in the industry. The total funds deployed (shareholders' funds plus borrowed funds) grew 3.61 times from INR4,140 million in 2004 to INR14,969 million by 2013. Since the company had made no equity infusions after its IPO in 1987, its entire capital expenditure was funded from retained earnings and borrowings. The Indian primary market for equity remained active during this period; however, AIS did not tap this market and continued to rely on internal accruals and borrowed funds to fund its expansion (see Exhibit 5). In 1997, the share capital of the company consisted of 1.85 million equity shares, each with a face value of INR10 (aggregating to INR18.5 million), of which 40 per cent was raised through AIS's initial public offering in 1987. Its share capital increased to INR74 million through two successive bonus issues in the ratio of 1:1 in 1998 and 2002. The company's share capital increased further in 2002 to INR80 million, following its merger with Floatglass India Limited. The same year, the face value of its shares fell to INR1 each through a 10 for 1 split of shares. AIS made its third bonus issue in the ratio of 1:1 in 2005. Almost 85 per cent of the shares outstanding had been issued as bonus shares through the capitalization of reserves. The company had ploughed back a large part of its profits over the years into reserves and surplus, which amounted to INR2,785 million as on March 31, 2008. However, due to losses suffered during the subsequent years, its reserves and surplus stood at a mere INR388 million as on March 31, 2013. For the shareholding pattern of the company as on June 30, 2013 see Exhibit 6. From the very beginning, the company had maintained an aggressive debt-equity ratio to fund its capital expenditures. Its very first project was funded with a debt-equity ratio of 5.5:1. The debt level of the company increased significantly from 2004 onward, resulting in a substantial increase in interest costs. Interest was a tax-deductible expense under the Indian Income Tax Act, 1961. With AIS's corporate tax rate of more than 30 per cent, the after-tax cost of debt was much lower due to this tax shield. Further, as per the applicable Indian accounting standards, the interest on borrowed funds used to acquire or construct a long- term asset could be capitalized until the asset was ready for its intended use, rather than including it in the income statement of the relevant year. However, once the facilities were put into operation, the interest on borrowed funds was treated as revenue expenditure, thereby reducing profitability. A large portion of the loans were secured with the company's assets as collateral. The lenders also imposed significant restrictive covenants on the company and required it to regularly share financial information (see Exhibit 7). Many of the company's loans were in foreign currency (see Exhibit 8) including interest-free loans from AGC. The interest rate on foreign currency loans was usually lower than the interest rate on rupee loans. However, the depreciation of the rupee against foreign currencies led to foreign-exchange losses, raising the real cost of the foreign currency loans (see Exhibit 9). In its 2005/06 annual report, the company stated: Glass is a capital intensive business, and projects especially for float glass have a long gestation period. We are currently in this process, i.e., putting in the investments into projects to build capacities and capabilities with a focus on capturing and leveraging each element of the auto and architectural glass value chains. The existing debt level reflects the fact that these projects are in execution phase and have yet to add to our top and bottom lines. Although most of our projects will be commissioned in the last quarter of the current fiscal, they will effectively contribute from next fiscal (2007-08) onwards, resulting in improved cash flows. This will help in reducing the debt levels significantly and improve the structural ratios from 2007-08 onwards. The borrowings of the company increased further in 2008. The management justified the increase by saying: The increase in borrowings of AIS has been mainly short term borrowings on account of increased working capital requirement. There are no major capital expansion programs in 2008- 09, hence, long term borrowings are not expected to increase. Routine capital expenditure programs shall be met from internal accruals. The major concern remains the volatility of the Indian rupee against the U.S. dollar. AIS has substantial foreign currency borrowings and if the Indian rupee continues to depreciate against the U.S. dollar, profitability of 2008-09 may be negatively impacted. 13 The borrowing level of the company continued to increase in the subsequent years, resulting in a higher interest burden. AIS delayed the repayment of two loan installments of INR42 million each to the lending banks by three days and 25 days, respectively, and requested its bank to reschedule the repayment of INR200 million in 2009. With increased losses and difficulties in debt servicing, AIS, in its 2008/09 annual report, took note of its high level of borrowings: The Company is fully cognizant of the fact that there is need to reduce the borrowings and thus the interest cost and has been objectively working towards it. On the operations side, AIS is making all efforts to manage its working capital, including optimizing its inventory and maximizing debtors' realizations so that working capital needs are reduced to the feasible minimum. AIS is in discussions with its lenders to restructure the tenor of some of the loans which would allow the Company to improve its cash flow without altering its overall loan obligations or interest cost. Some of these discussions are in advanced stages. AIS has also been successful in converting some of its short-term borrowings into longer tenors whereby again, operational cash flows would be positively impacted


