Answered step by step
Verified Expert Solution
Question
1 Approved Answer
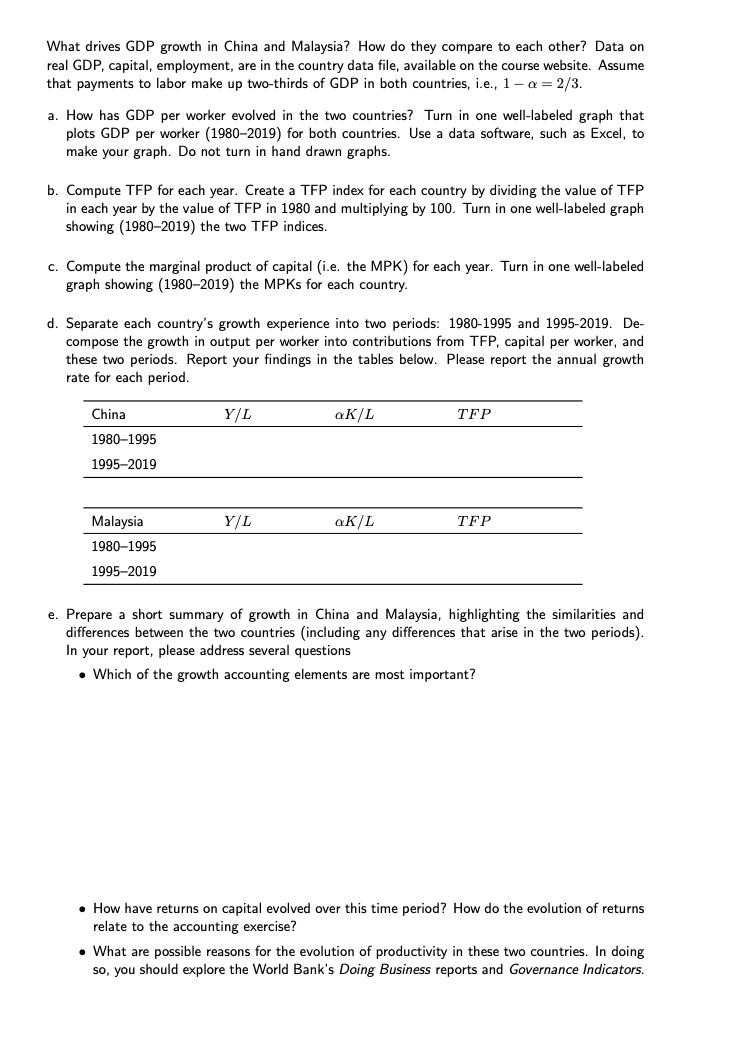
What drives GDP growth in China and Malaysia? How do they compare to each other? Data on real GDP, capital, employment, are in the

What drives GDP growth in China and Malaysia? How do they compare to each other? Data on real GDP, capital, employment, are in the country data file, available on the course website. Assume that payments to labor make up two-thirds of GDP in both countries, i.e., 1-a = 2/3. a. How has GDP per worker evolved in the two countries? Turn in one well-labeled graph that plots GDP per worker (1980-2019) for both countries. Use a data software, such as Excel, to make your graph. Do not turn in hand drawn graphs. b. Compute TFP for each year. Create a TFP index for each country by dividing the value of TFP in each year by the value of TFP in 1980 and multiplying by 100. Turn in one well-labeled graph showing (1980-2019) the two TFP indices. c. Compute the marginal product of capital (i.e. the MPK) for each year. Turn in one well-labeled graph showing (1980-2019) the MPKs for each country. d. Separate each country's growth experience into two periods: 1980-1995 and 1995-2019. De- compose the growth in output per worker into contributions from TFP, capital per worker, and these two periods. Report your findings in the tables below. Please report the annual growth rate for each period. China 1980-1995 1995-2019 Y/L aK/L TFP Malaysia Y/L aK/L TFP 1980-1995 1995-2019 e. Prepare a short summary of growth in China and Malaysia, highlighting the similarities and differences between the two countries (including any differences that arise in the two periods). In your report, please address several questions Which of the growth accounting elements are most important? How have returns on capital evolved over this time period? How do the evolution of returns relate to the accounting exercise? What are possible reasons for the evolution of productivity in these two countries. In doing so, you should explore the World Bank's Doing Business reports and Governance Indicators.
Step by Step Solution
There are 3 Steps involved in it
Step: 1
To answer the questions I will use the data provided in the country data file a GDP per worker evolution The graph below shows the evolution of GDP pe...
Get Instant Access to Expert-Tailored Solutions
See step-by-step solutions with expert insights and AI powered tools for academic success
Step: 2

Step: 3

Ace Your Homework with AI
Get the answers you need in no time with our AI-driven, step-by-step assistance
Get Started


