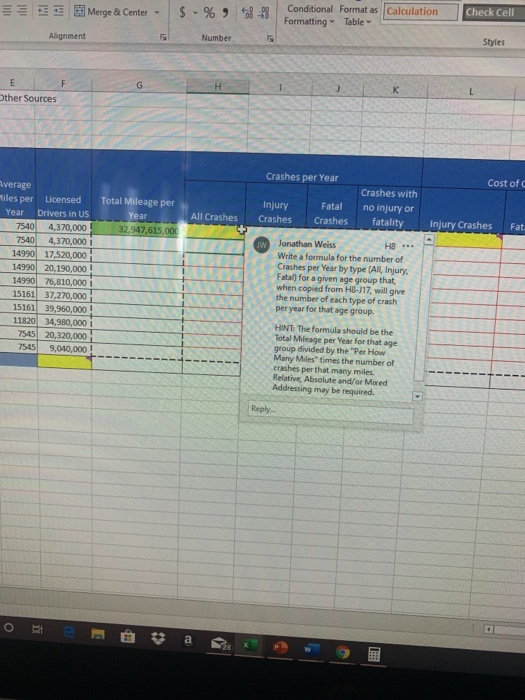
what formula should i put in h8
Merge & Center - $ - % 48-58 Conditional Format as Formatting Table Calculation Check Cell Alignment Number Styles Other Sources Crashes per Year Cost of Injury Crashes All Crashes Crashes with no injury or fatality Fatal Crashes Injury Crashes Fat JW average Miles per Licensed Total Mileage per Year Drivers in US Year 75404,370,000 32,947,615,000 7540 4,370,000 i 14990 17,520,000 14990 20,190,000! 14990 76,810,000 i 15161 37,270,000 15161 39,960,000! 11820 34,980,000 7545 20.320,000 7545 9,040,000! - Jonathan Weiss HS ... Write a formula for the number of Crashes per Year by type (All Injury. Fatal) for a given age group that when copied from HB-J17, will give the number of each type of crash per year for that age group. 1 HINT: The formula should be the Total Mileage per Year for that age group divided by the "Per How Many Miles times the number of crashes per that many miles. Relative, Absolute and/or Mored Addressing may be required. | Reply.. 1 Statistics Based on the Automobile Association of America and Other Sources Per How Many Miles? 100,000,000 -Nmne EN Crashes per Year Age of Driver All Crashes Injury Crashes Fatal Crashes 3. 75 2.47 1432 Total Mileage per Year 32.547,615,000 Injury Crashes All Crashes Fatal Crashes Average Miles per Licensed Year Drivers in US 7 5404,370.000 7 540 4,370.000 14990 17.520.000 14990 20,190,000 14990 76,810,000 I 1516137,270.000 1516139,960,000! 1182034,980,000 7545 20.320,000 75459,040,000 Jonathan Weiss Write a formula forth Crashes per year byty Fata for a given ages when copied from HS the number of each ty per year for that agegn Salari HINT The formula show Total Mleage per year fe group divided by the " Mary Miles times then Sashes per that manym Relative, Absolute and/o Addressing may be requi Cost of Crashes Crashes with no 22 injury or fatality $3,231.00 23 Injury Crashes $15,443.00 24 Fatal Crashes $25,000.00 NNNNN Crash Statistics