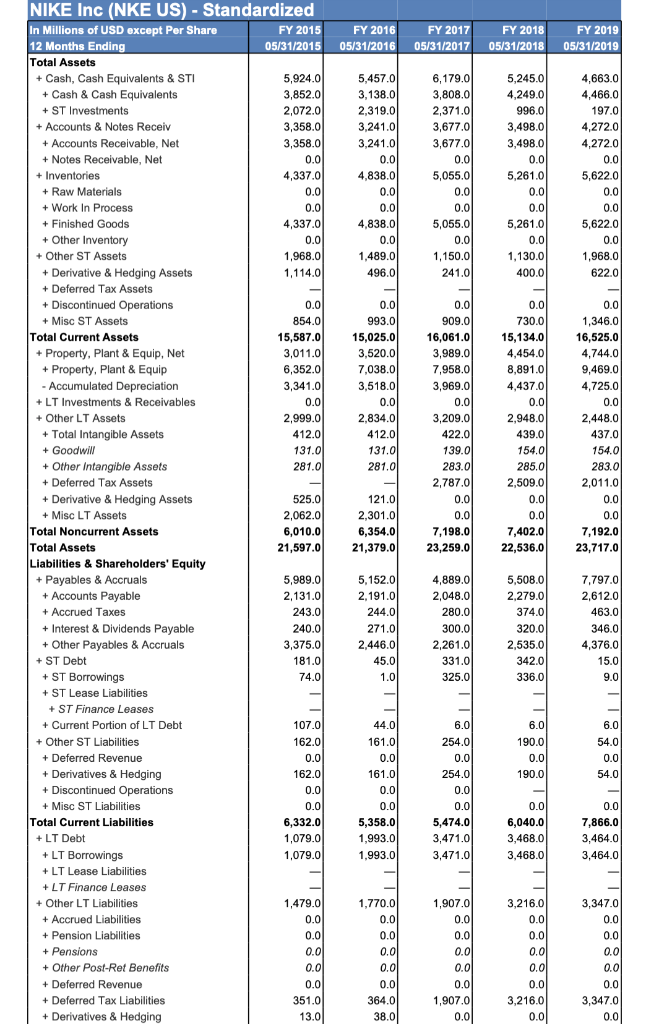
What is Nike's inventory turnover for the period ending May 31, 2019?
Group of answer choices
3.85
3.98
9.41
5.01
3.79
What is Nike's fixed asset turnover for the period ending May 31, 2019? Use Property Plant and Equipment (not the Net amount) for Fixed Assets.
Group of answer choices
0.51
0.96
4.46
4.13
5.36
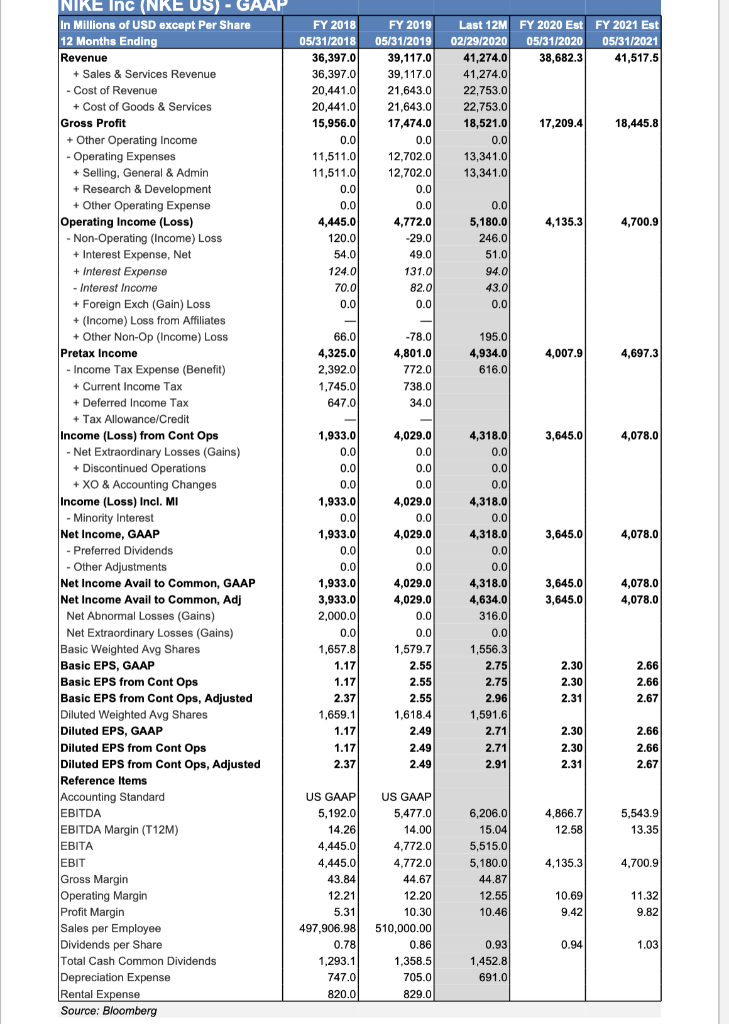
What is Nike's EPS on 5/31/2019? Hint: see row 45 of Nike's Income Statement. It is already calculated for you.
Group of answer choices
Nike's EPS is 2.55
Nike's EPS is 2.75
Nike's EPS is 3.24
Nike's EPS is 1.17
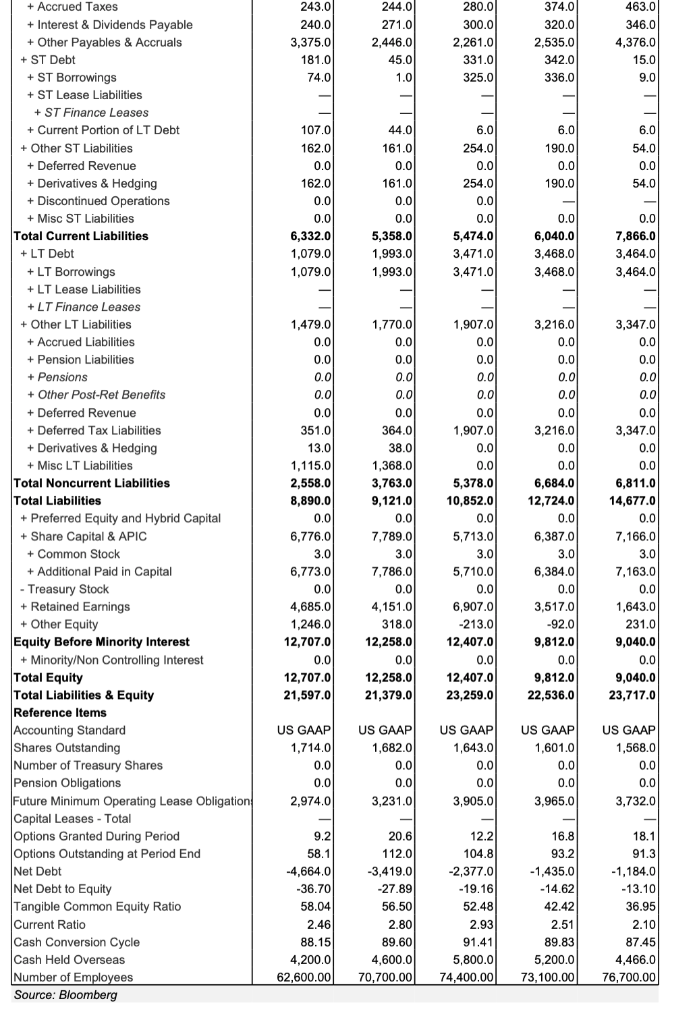
What is Nike's debt ratio for the period ending May 31, 2019?
Group of answer choices
61.88%
14.67%
20.63%
19.52%
17.47%
What is Nike's return on equity for the period ending May 31, 2019? Use Total Equity for Common Equity.
Group of answer choices
20.00%
33.08%
43.05%
44.57%
35.57%
NIKE Inc (NKE US) - GAAP In Millions of USD except Per Share 12 Months Ending Revenue FY 2018 05/31/2018 36,397.0 36.397.0 20,441.0 20,441.0 15,956.0 0.0 11,511.0 11,511.0 0.0 0.0 4,445.0 120.0 54.0 124.0 70.0 0.0 FY 2019 05/31/2019 39,117.00 39,117.0 21,643.0 21.643.00 17,474.0 0.0 12,702.0 12,702.0 0.0 0.0 4,772.0 -29.0 49.0 131.0 82.01 0.01 Last 12M FY 2020 Est FY 2021 Est 02/29/2020 05/31/2020 05/31/2021 41,274.0 38,682.3 41,517.5 41,274.0 22,753.0 22,753.0 18,521.00 17,209.4 18,445.8 0.00 13,341.0 13,341.0 4,135.3 4,700.9 0.0 5,180.0 246.0 51.0 94.01 43.01 0.0 66.0 4,325.0 2,392.0 195.0 4,934.0 616.01 4,007.9 -78.0 4,801.0 772.0 738.0 34.0 4,697.3 1,745.0 + 647.0 3,645.0 3,645.0 4,078.0 + Sales & Services Revenue - Cost of Revenue Cost of Goods & Services Gross Profit + Other Operating Income Operating Expenses + Selling, General & Admin + Research & Development + Other Operating Expense Operating Income (Loss) - Non-Operating (Income) Loss + Interest Expense, Net + Interest Expense - Interest Income + Foreign Exch (Gain) Loss + (Income) Loss from Affiliates + Other Non-Op (Income) Loss Pretax Income -Income Tax Expense (Benefit) + Current Income Tax + Deferred Income Tax + Tax Allowance/Credit Income (Loss) from Cont Ops Net Extraordinary Losses (Gains) + Discontinued Operations O & Accounting Changes Income (Loss) Incl. MI - Minority Interest Net Income, GAAP - Preferred Dividends Other Adjustments Net Income Avail to Common, GAAP Net Income Avail to Common, Adj Net Abnormal Losses (Gains) Net Extraordinary Losses (Gains) Basic Weighted Avg Shares Basic EPS, GAAP Basic EPS from Cont Ops Basic EPS from Cont Ops, Adjusted Diluted Weighted Avg Shares Diluted EPS, GAAP Diluted EPS from Cont Ops Diluted EPS from Cont Ops, Adjusted Reference Items Accounting Standard EBITDA EBITDA Margin (T12M) EBITA |EBIT 1,933.0 0.0 0.0 0.01 4,029.0 0.0 0.0 0.0 1,933.0 3,645.0 4,078.0 3,645.0 3,645.0 4,318.0 0.01 0.01 0.0 4,318.00 0.0 4,318.0 0.0 0.0 4,318.0 4,634.0 316.0 0.0 1,556.3 2.75 2.75 2.96 1,591.6 2.71 2.71 2.91 0.0 22 1,933.0 0.0 0.0 1,933.0 3,933.0 2,000.0 0.0 1,657.8 1.17 1.17 2.37 1,659.1 1.17 1.17 2.37 4,078.0 4,078.0 4,029.0 0.0 4,029.0 0.0 0.0 4,029.0 4,029.0 0.0 0.0 1,579.7 2.55 2.55 2.55 1,618.4 2.49 2.49 2.49 2.30 2.30 2.31 2.66 2.66 2.67 2.30 2.30 2.31 2.66 2.66 2.67 4,866.7 12.58 5,543.9 13.35 4,135.3 6,206.0) 15.04 5,515.0 5,180.00 44.87 12.55 10.46 4,700.9 Gross Margin US GAAP 5,192.0 14.26 4,445.00 4,445.0 43.84 12.21 5.31 497,906.98 0.78 1,293.1 747.0 820.0 US GAAP 5,477.0 14.00 4.772.0 4,772.0 44.67 12.20 10.30 510,000.00 0.86 1,358.5 705.0 10.69 9.42 11.32 9.82 0.94 Operating Margin Profit Margin Sales per Employee Dividends per Share Total Cash Common Dividends Depreciation Expense Rental Expense Source: Bloomberg 1.03 0.93 1,452.8 691.0 829.0 + Work In Process 4,337.01 909.0 2,999.0 703R ol 3,969.01 3,209.01 NIKE Inc (NKE US) - Standardized In Millions of USD except Per Share FY 2015 FY 2016 FY 2017 FY 2018 FY 2019 12 Months Ending 05/31/2015 05/31/2016 05/31/2017 05/31/2018 05/31/2019 Total Assets + Cash, Cash Equivalents & STI 5,924.0 5,457.0 6,179,0 5.245.0 4,663.0 Cash & Cash Equivalents 3,852.0 3,138.0 3,808,0 4,249.0 4,466.0 ST Investments 2,072.0 2,319.0 2,371.0 996.0 197.0 + Accounts & Notes Receiv 3,358.0 3,241.0 3,677.0 3,498.0 4,272.0 + Accounts Receivable, Net 3,358.0 3,241.0 3,677,0 17.0 3,498.0 4,272.0 + Notes Receivable, Net 0.0 0.0 0.0 0.0 0.0 0.0 0.0 0.0 Inventories 4,337.0 4,838.0 5,055.0 0000 5,261.0 5,622.0 + Raw Materials 0.0 0.0 0.0 0.0 0.0 0.0 0.0 V. VU 0.0 0.0 0.0 0.0 0.0 V. 0.0 V. DU + Finished Goods 4,838.0 5,055.0 030. 5,261.0 5,622.0 + Other Inventory 0.0 0.01 0.0 0.0 0.0 0.00 V.V + Other ST Assets 1,968.0 1,489.0 1,150.0 1,130.0 1,968.0 + Derivative & Hedging Assets 1,114.0 496.0 241.0 400.0 622.0 + Deferred Tax Assets + Discontinued Operations 0.0 00 0.0 0.0 0.0 0.0 0.0 + Misc ST Assets 854.0 993.0 730.0 1,346.0 Total Current Assets 15,587.0 15,025.0 16,061.0 15,134.0 16,525.0 + Property, Plant & Equip, Net 3,011.0 3,520.0 3,989.0 4,454.0 4,744.0 + Property, Plant & Equip 6,352.0 7,958.0 8,891.0 9,469.0 4270 - Accumulated Depreciation 2518 3,341.0 3,518.0 4,437.0 4,725.0 +LT Investments & Receivables 0.0 0.0 0.0 0.0 0.0 + Other LT Assets 2,834.0 2,948.0 08 2,448.0 4480 1990 42 4200 4270 + Total Intangible Assets 412.0 412.0 422.0 439.0 437.0 Goodwill 1540 + Goodwill 131.0 131.0 139.0 154.0 154.01 + Other Intangible Assets 281.0 281.0 283.0 285.0 283.0 Deferred Tax Assets 2,787.0 2,509.0 2,011.0 Derivative & Hedging Assets 525.01 121.0 0.0 0.0 0.0 2,062.01 2,301.0 0.0 0.0 0.0 Total Noncurrent Assets 6,010.0 7,198.0 7,192.0 Total Assets 21,597.0 21,379.0 23,259.0 22,536.0 Liabilities & Shareholders' Equity + Payables & Accruals 4,889.01 5,508.0 + Accounts Payable 2,131.0 2,191.0 2,048.00 2,6120 + Accrued Taxes 243.0 244.0 280.0 374.0 463.0 + Interest & Dividends Payable 240.00 271.0 300.0 346.0 + Other Payables & Accruals 3,375.0 2,446.0 2,261.0 2,535.0 4,376.0 + ST Debt 181.0 45.0 331.01 342.0 15.0 +ST Borrowings 74.00 1.0 325.0 336.0 9.0 + ST Lease Liabilities + ST Finance Leases + Current Portion of LT Debt 107.0 44.0 6.0 6.01 6.0 + Other ST Liabilities 162.0 161.0 254.0 190.00 54.0 + Deferred Revenue 0.0 0.0 0.0 0.00 0.0 A 0 + Derivatives & Hedging 162.0 161.0 254.0 190.0 54.0 + Discontinued Operations no 0.0 0.0 0.0 + Misc ST Liabilities 0.0 0.0 0.0 0.0 0.0 Total Current Liabilities 6,332.0 5,474.0 6,040.0 7,866.0 +LT Debt 1,079.0 1,993.0 3,471.0 3,468.0 3,464.0 +LT Borrowings 1,079.0 1,993.0 3,471.0 3,468.0 3,464.0 + LT Lease Liabilities +LT Finance Leases + Other LT Liabilities 1,479.0 1,770.0 1,907.01 3.216.00 3,347.0 + Accrued Liabilities 0.0 0.0 0.0 0.0 0.0 + Pension Liabilities 0.0 0.0 0.0 0.0 0.0 0.0 + Pensions 0.0 0.0 0.0 0.0 0.0 0.0 0. 0.0 + Other Post-Ret Benefits 0.0 0.0 0.0 0.0 0. 0.0 + Deferred Revenue 0.0 0.0 0.0 0.0 0.0 + Deferred Tax Liabilities 364.0 1,907.0 3,216.0 3,347.0 + Derivatives & Hedging 13.0 38.00 0.01 0.0 0.0 + Misc LT Assets 6,354.0 7,402.0 23,717.0 5,989.0 5.152.0 7,797.0 2,279.0 320.01 5,358.0 351.0 243.0 240.0 3,375.0 181.0 74.0 244.0 271.0 2,446.0 45.0 1.0 280.0 300.0 2,261.0 331.0 325.0 374.0 320.0 2,535.0 342.0 336.0 463.0 346.0 4,376.0 15.0 9.0 6.0 190.0 0.0 190.0 6.0 54.0 0.0 54.0 107.0 162.0 0.0 162.0 0.0 0.0 6,332.0 1,079.0 1,079.0 44.0 161.0 0.0 161.0 0.0 0.0 5,358.0 1,993.0 1,993.0 6.0 254.0 0.0 254.0 0.0 0.0 5,474.0 3,471.0 3,471.0 0.0 6,040.0 3,468.0 3,468.0 0.0 7,866.0 3,464.0 3,464.0 3,347.0 0.0 0.0 0.0 0.0 + Accrued Taxes + Interest & Dividends Payable + Other Payables & Accruals + ST Debt + ST Borrowings + ST Lease Liabilities + ST Finance Leases + Current Portion of LT Debt + Other ST Liabilities + Deferred Revenue + + Derivatives & Hedging + Discontinued Operations + Misc ST Liabilities Total Current Liabilities + LT Debt +LT Borrowings + LT Lease Liabilities +LT Finance Leases + + Other LT Liabilities + Accrued Liabilities + Pension Liabilities + Pensions + Other Post-Ret Benefits + Deferred Revenue + Deferred Tax Liabilities + Derivatives & Hedging + Misc LT Liabilities Total Noncurrent Liabilities Total Liabilities + Preferred Equity and Hybrid Capital + Share Capital & APIC + Common Stock + Additional Paid in Capital - Treasury Stock + Retained Earnings + Other Equity Equity Before Minority Interest + Minority/Non Controlling Interest Total Equity Total Liabilities & Equity Reference Items Accounting Standard Shares Outstanding Number of Treasury Shares Pension Obligations Future Minimum Operating Lease Obligation Capital Leases - Total Options Granted During Period Options Outstanding at Period End Net Debt Net Debt to Equity Tangible Common Equity Ratio Current Ratio Cash Conversion Cycle Cash Held Overseas Number of Employees Source: Bloomberg 1,479.0 0.01 0.00 0.01 0.0 0.0 351.0 13.0 1,115.0 2,558.0 8,890.0 0.0 6.776.0 3.0 1,770.0 0.0 0.0 0.0 0.0 0.0 364.0 38.0 1,368.0 3,763.0 9,121.0 0.0 7,789.0 3.0 7,786.0 0.0 4,151.0 318.0 12,258.0 0.0 12,258.0 21,379.0 1,907.0 0.0 0.0 0.0 0.0 0.0 1,907.0 0.01 0.0 5,378.0 10,852.00 0.0 5,713.0 3.0 5,710.01 0.0 6,907.0 -213.0 12,407.0 0.0 12,407.0 23,259.0 3,216.0 0.0 0.0 0.0 0.0 0.0 3,216.0 0.0 0.0 6,684.0 12,724.0 0.0 6,387.0 3.0 6,384.0 0.0 3,517.0 -92.0 9,812.0 0.0 9,812.0 22,536.0 0.0 3,347.0 0.0 0.0 6,811.0 14,677.00 0.0 7.166.0 3.0 7.163.0 0.0 1.643.0 231.0 9,040.0 0.0 9,040.0 23,717.0 6,773.0 0.0 4,685.0 1,246.0 12,707.0 0.0 12,707.0 21,597.0 US GAAP 1,714.01 0.0 0.0 2,974.0 US GAAP 1,682.0 0.0 0.0 3,231.0 US GAAP) 1,643.0 0.0 0.0 3,905.0 US GAAP 1,601.01 0.0 0.0 3,965.0 US GAAP 1,568.0 0.0 0.0 3,732.0 9.2 58.1 -4,664.0 -36.70 58.04 2.46 88.15 20.6 112.0 -3,419.0 -27.89 56.50 2.80 89.60 4,600.0 70,700.00 12.2 104.8) -2,377.0 -19.16 52.48 2.93 91.41 5,800.0 74,400.00 16.8 93.2 -1,435.0 - 14.62 42.42 2.51 89.83 5,200.0 73,100.00 18.1 91.3 -1,184.0 -13.10 36.95 2.10 87.45 4,466.0 76,700.00 4,200.0 62,600.00