what is sales?
cost of good goods ? gross profit ? depreciation?
selling and admin expense?
other operating expense?
net operating income ?
interest expense ?
earnings before taxes ?
taxes?
net income ?
tax rate% (found online) 2018= 9.2% 2017=15.2% 2016=28.3%
addition to RE?
dividends in 2016 ?
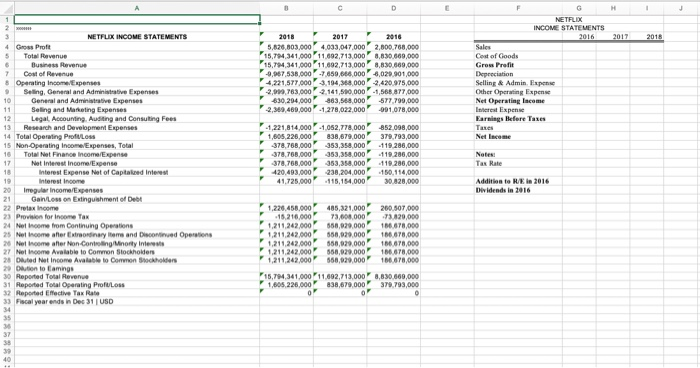
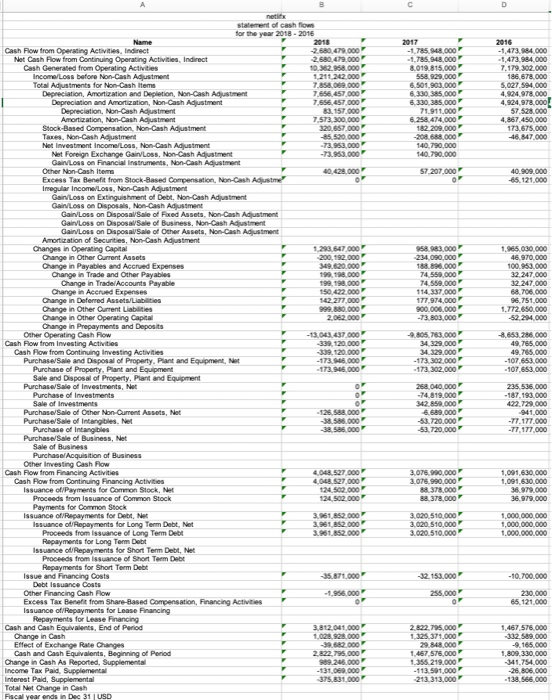
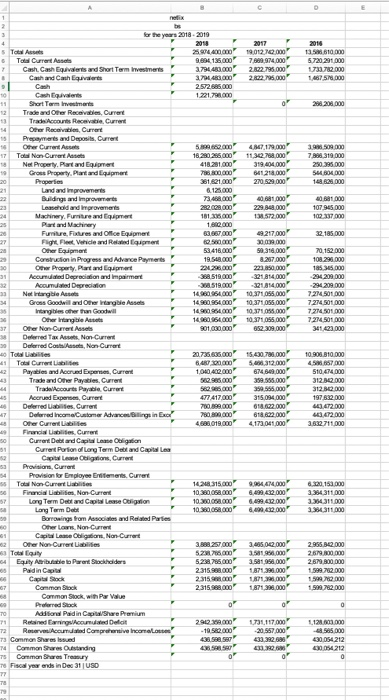
c D H 2017 2018 2018 2017 5.620,003.000 4033,047 000 2.000.768,000 15,794,341,000 11.692.713,000 8830 809,000 15,794, 341.000 11.692,713,000 8,830,669,000 -9,967,538,000 -7,659,666,000 5,020.901,000 4,221,577,000 3,194,368,000 -2,420.075,000 2.999,763,000.141,600,000 1,568 877,000 630,204.000 863,568,000 577.700,000 2,369,460,000 -1.278,022,000 -901,078,000 F G NETFLIX INCOME STATEMENTS 2016 Sales Cost of Goods Grow Profit Depreciation Selling & Admin Expense Other Operating Expense Net Operating Income Interest Expense Earnings Before Taxes Taxes Net Income 18 NETFLIX INCOME STATEMENTS 4 Pro 5 Total Revenue Business Revenue 7 Cost of Revenue & Operating Income/Expenses . Selling General and Administrative Expenses 10 General and Administrative Expenses 11 Selling and Marketing Expenses 12 Legal Accounting, Auditing and Consulting Fees 13 Research and Development Expenses 14 Total Operating Prof Loss 15 Non-Operating Income Expenses, Total Total Net Finance Incom/Expense Net Interest income Expense 18 Interest Expense Net of Captal ed interest 19 Interest Income Irregular Income Expenses 21 Gan/Los on Extinguishment of Debt 22 Pretax income 23 Provision for Income Tax 24 Not Income from Continuing Operations 25 Not Income after ordinary there and Discontinued Operations 26 Nof income after Non-Controlling/Minorty Invier 27 Not Income Avalable to Common Stockholders 28 luted Net Income Avalable to common Stockholders 20 Olution to Caming 30 Reported Total Revenue 31 Reported Total Operating Profulos 32 Reported Effective Tax Rate 33 Focal year ends in Dec 31 USD 35 37 -1,221,814,000.1,052,778,000 -852098,000 1,605,226,000 838,670,000 379,793,000 -378,768,000 353,358,000 -119.286,000 -378,768.000 353,358,000 119.286,000 378,768,000 363,358,000 -119.286,000 420,493,000 238,204,000 150.114,000 41.725,000 -115,154,000 30.828,000 Notes: Tax Rate Addition to RE in 2016 Dividends in 2016 1,226,458,000 405,321.000 200.607.000 -15.216.000 73,000,000 -73.120,000 1.211.242.000 568,029,000 186.678,000 1,211,242.000 568,020,000 186,678,000 1,211, 242,000 568,020,000 106.678,000 1,211,242,000 $60,029,000 186.678,000 1,211,242,000 $68,020,000 186.678,000 15,794,341,000?11.692,713,000 8,830,000,000 1,605,226,000 838,679,000 379.793,000 0 40 D 2017 -1.785.948.000 -1.785.948.000 8.019.815.000 558.920,000 6.501.900.000 6.330.385.000 6.330 385.000 71.911.000 6258 474,000 182 200.000 -208.688.000 140.790.000 140.790.000 2016 -1.473.84.000 -1,473,984.000 7.179.302.000 186,678,000 5.027,594.000 4.924.978.000 4,924.978.000! 57.528.000 4.867.450,000 173.675.000 46.847.000 S7 207.000 40.909 000 15.121.000 958.983.000 -234.000.000 188.800.000 74.550.000 74.559.000 114.337.000 177,974.000 900.000.000 -73.803,000 1.965.030.000 46,970.000 100.963.000 32.247.000 32.247.000 68.706.000 96.751.000 1.772.650.000 -52.20.000 net statement of cash flow for the year 2018 - 2016 Name 2018 Cash Flow from Operating Activities. Indirect -2.680.478.000 Net Cash Flow from Continuing Operating Activities. Indirect 2.580.479.000 Cash Generated from Operating Activities 10.362.958.000 Income Loss before Non-Cash Adjustment 1.211.242.000 Total Adjustments for Non-Cash Items 7.858.000.000 Depreciation, Amortization and Depletion Non-Cash Adjustment 7.656.457.000 Depreciation and Amortization, Non-Cash Adjustment 7,656.457.000 Depreciation Non-Cash Adjustment 83.157.000 Amortization, Non-Cash Adjustment 7573 300 000 Stock-Based Compensation, Non-Cash Adjustment 320.657.000 Twe, Non-Cash Adjustment 85.520.000 Net Investment Income/Loss, Non-Cash Adjustment -73.950.000 Net Foreign Exchange Gain Loss, Non-Cash Adjustment -73.950.000 Gair Loss on Financial Instruments, Non-Cash Adjustment Other Non-Cash Items 40.428.000 Excess Tax Benefit from Stock-Based Compensation, Non-Cash Adjustme Irregular Income Loss, Non-Cash Adjustment Gain Loss on Extinguishment of Debt, Non-Cash Adjustment Gain/Loss on Disposals. Non-Cash Adjustment Gain/Loss on Disposal/Sale of Fixed Assets, Non-Cash Adjustment Gain/Loss on Disposal/Sale of Business, Non-Cash Adjustment Gain Loss on Disposal/Sale of Other Assets, Non-Cash Adjustment Amortization of Securities, Non-Cash Adjustment Changes in Operating Capital 1.283.647 000 Change in Other Current Assets 200. 192.000 Change in Payables and Accrued Expenses 349.620.000 Change in Trade and Other Payables 199.190.000 Change in Trade/Accounts Payable 199.198.000 Change in Accrued Expenses 150.422.000 Change in Deferred Assets/Libilities 142.277.000 Change in Other Current Liabilities 990. 80.000 Change in Other Operating Capital 2.062.000 Change in Prepayments and Deposits Other Operating Cash Flow -13.043.437 000 Cash Flow from Investing Activities -339, 120.000 Cash Flow from Continuing Investing Activities -339, 120.000 Purchase/ Sale and Disposal of Property. Plant and Equipment, Net - 173.000 Purchase of Property. Plant and Equipment - 173.986.000 Sale and Disposal of Property. Plant and Equipment Purchase/Sale of Investments, Net Purchase of investments OF Sale of Investments Purchase/Sale of Other Non-Current Assets, Net - 126.583.000 Purchase/Sale of Intangibles. Net -38.580.000 Purchase of Intangibles -38.586.000 Purchase/Sale of Business, Net Sale of Business Purchase/Acquisition of Business Other Investing Cash Flow Cash Flow from Financing Activities 4,048.527.000 Cash Flow from Continuing Financing Activities 4.048 527.000 Issuance of Payments for Common Stock, Net 124502.000 Proceeds from Issuance of Common Stock 124.502.000 Payments for Common Stock Issuance of/Repayments for Debt, Net 3.961.852.000 Issuance od Repayments for Long Term Debt, Net 3.961.852.000 Proceeds from Issuance of Long Term Debt 3.901.852.000 Repayments for Long Term Debt Issuance of/Repayments for Short Term Debt, Net Proceeds from Issuance of Short Term Debt Repayments for Short Term Debe Issue and Financing Costs -35.871.000 Debt Issuance costs Other Financing Cash Flow Excess Tax Benefit from Share-Based Compensation, Financing Activities Issuance of/Repayments for Lease Financing Repayments for Lease Financing Cash and Cash Equivalents, End of Period 3.812.041.000 Change in Cash 1.028.928,000 Effect of Exchange Rate Changes Cash and Cash Equivalents, Beginning of Period 2.822.795.000 Change in Cash As Reported. Supplemental 989.245.000 Income Tax Paid. Supplemental -131.000.000 Interest Paid, Supplemental 375.831.000 Total Net Change in Cash Fiscal year ends in Dec 31 USD -9.805.763.000 34 320.000 34.329,000 -173.302.000 -173.302.000 8.653.286.000 49.765.000 49.765.000 -107.653.000 - 107.653.000 F 258.040,000 -74.819.000 342.850.000 6.689.000 -53.720.000 53.720,000 235, 536.000 -187.190.000 422.729.000 -941.000 -77.177.000 -77,177,000 F F 3.076.900.000 3.076,990,000 88.378,000 88.378,000 1.091.630.000 1,091,630.000 36.979.000 36,979,000 3.020.510,000 3.020.510,000 3.020.510.000 1.000.000.000 1,000,000,000 1.000.000.000 -32.153,000 -10.700.000 255.000 230.000 65. 121.000 F 2.822.795,000 1.325, 371,000 29.848 000 1.467,578,000 1.356.219.000 -113.501.000 -213313.000 1.467.576.000 -332.589.000 -9.165.000 1,809, 330.000 341.754.000 -138.566.000 2017 1902 7.0 74.000 2.002.795.000 20200 2014 135 610 000 5720 201 000 2000 1467 50.000 0" 200 200 000 11 13 4M 1.000 11.32.768.000 319.404.000 642.000 270.9.000 1998 500 000 7.08.319.000 250.395.000 5 B04000 148 620.000 23 0681000 229 88.000 13.572.000 0681000 107 945.000 102.337.000 32.185.000 70.152.000 108.295.000 185 35.000 49.217.000 300.000 50.318.000 6.267.000 2230 000 -321.814.000 21814.000 10:371055.000 10.371055.000 10:31.055.000 10:371055.000 652 300 000 294 209.000 7274.501.000 7274.501.000 721401.000 7214.501 000 341423.000 1 2 for the year 2018 - 2010 4 204 5 Total 25904400 Total Current Assets 9.60 15.000 Cash Cash Equivalents and Short Term Trivestments 3.79140.000 Cash and Ch queres 3.70 2.572685.000 Cash Eques 1221.790.000 Short Term nemor Trade and Other Receivables, Current Trades Account Recovei, Current 14 Other Receive Current Prepayments and Deposits. Current Cr Asts | 51.000 17 Total Non Current 18.280 2800 Net Property. Part and Equipment 418.281.000 10 Cross Property, Pantand Equipment 700 000 Properties 381.21.000 Land and improvements 0.125.000 Buildings and improve 73 Loretold and provenient 282.com Machinery, Furniture and Equipment 18135.00 Part and Machinery 1.800.000 Furniture Fixtures and Office Equipment Flight Fleet Veride and Related Equipment Other Equipment 53.416.000 Construction in Progress and Advance Parts 19.548.000 Other Property Part and Equipment 225.000 Accumulated Depreciation and impairment 368 519.000 Acounted Depreciation 08.510.000 Netragble Asset 14.00 Gross Goodwill and Other Intangible Assets 14.960 640 Intybiersther than Goodwill 1490 Other Ingible Assets 140 68.000 Other Non Current 901 con Deferred Tax Assets Non-Current Deferred Contrast, Non Current 40 Total des 20.735.695.000 1 640000" Payales and Accrued Experts, Current 1,040.400 000 Trade and Paysles. Current 562 .." Trade Accounts Payabile. Current 55.000 45 Accrued Expenses. Current 477,417,000 Deard , Deferred Income Customer Advancing in Earl 780.800.000 Other Current Liabilities 468 019.000 Financial Life Current Current Debt and Capital Laste Obligation Current Portion of Long Term Debt and Capital Les Capital Lease Obligations. Current Provision Current Provision for Employee Eifers. Current Ta Na 140315.000 Financial Liabile. Non Current 10.300.000 Long Term Debt and Capital Cligion 10.300.000 Long Term Delt 100 Borrowings from Associates and Related Parties 0 Other Loans Non-Current Capital Lame Obligation. Non Current Other Non-Current Liabilities Totally 52.000 64 Equity Aribute to Port Stockholders 5.230.705.000 Paidin Cod 2315.968.000 Capital Sock 2,315.00 Common Stock 2.315 000 Common Stock, with Par Value Preferred Stock o 70 Additional Paidin Capital Share Premium 71 Retained Earnings Accumulated Delicit 291238.000 72 Reserve Accumdated Compreensive Incomalo - 10 50000 73 Common Shares issued 438 Commons Ong SSR Common Share Treasury OP 70 Fiscal year andsin De 31 USO 15.430 73.000 5.312.000 6 549.000 359.555.000 350.500.000 315.094.000 018.622.000 61.002.000 4.173.0000 10.903.310.000 459357000 510.414.000 312.302.000 312.02.000 197.632.000 64.472.000 3472.000 3.632711.000 954000 6.400 42.000 8.499 222.000 12 000 3354311.000 2.3214311.000 3.35.311.000 3.465.002.000 3.50 000 3.58100 1871.39.000 17.000 11871 3000 2.956.162.000 2679.100.000 2679 800.000 1.599./12.000 1599 000 1.599.782.000 o' 0 731117.000 20557000 433.392. 1121.000.000 48.585.000 430.054 212 00054212 0 0 c D H 2017 2018 2018 2017 5.620,003.000 4033,047 000 2.000.768,000 15,794,341,000 11.692.713,000 8830 809,000 15,794, 341.000 11.692,713,000 8,830,669,000 -9,967,538,000 -7,659,666,000 5,020.901,000 4,221,577,000 3,194,368,000 -2,420.075,000 2.999,763,000.141,600,000 1,568 877,000 630,204.000 863,568,000 577.700,000 2,369,460,000 -1.278,022,000 -901,078,000 F G NETFLIX INCOME STATEMENTS 2016 Sales Cost of Goods Grow Profit Depreciation Selling & Admin Expense Other Operating Expense Net Operating Income Interest Expense Earnings Before Taxes Taxes Net Income 18 NETFLIX INCOME STATEMENTS 4 Pro 5 Total Revenue Business Revenue 7 Cost of Revenue & Operating Income/Expenses . Selling General and Administrative Expenses 10 General and Administrative Expenses 11 Selling and Marketing Expenses 12 Legal Accounting, Auditing and Consulting Fees 13 Research and Development Expenses 14 Total Operating Prof Loss 15 Non-Operating Income Expenses, Total Total Net Finance Incom/Expense Net Interest income Expense 18 Interest Expense Net of Captal ed interest 19 Interest Income Irregular Income Expenses 21 Gan/Los on Extinguishment of Debt 22 Pretax income 23 Provision for Income Tax 24 Not Income from Continuing Operations 25 Not Income after ordinary there and Discontinued Operations 26 Nof income after Non-Controlling/Minorty Invier 27 Not Income Avalable to Common Stockholders 28 luted Net Income Avalable to common Stockholders 20 Olution to Caming 30 Reported Total Revenue 31 Reported Total Operating Profulos 32 Reported Effective Tax Rate 33 Focal year ends in Dec 31 USD 35 37 -1,221,814,000.1,052,778,000 -852098,000 1,605,226,000 838,670,000 379,793,000 -378,768,000 353,358,000 -119.286,000 -378,768.000 353,358,000 119.286,000 378,768,000 363,358,000 -119.286,000 420,493,000 238,204,000 150.114,000 41.725,000 -115,154,000 30.828,000 Notes: Tax Rate Addition to RE in 2016 Dividends in 2016 1,226,458,000 405,321.000 200.607.000 -15.216.000 73,000,000 -73.120,000 1.211.242.000 568,029,000 186.678,000 1,211,242.000 568,020,000 186,678,000 1,211, 242,000 568,020,000 106.678,000 1,211,242,000 $60,029,000 186.678,000 1,211,242,000 $68,020,000 186.678,000 15,794,341,000?11.692,713,000 8,830,000,000 1,605,226,000 838,679,000 379.793,000 0 40 D 2017 -1.785.948.000 -1.785.948.000 8.019.815.000 558.920,000 6.501.900.000 6.330.385.000 6.330 385.000 71.911.000 6258 474,000 182 200.000 -208.688.000 140.790.000 140.790.000 2016 -1.473.84.000 -1,473,984.000 7.179.302.000 186,678,000 5.027,594.000 4.924.978.000 4,924.978.000! 57.528.000 4.867.450,000 173.675.000 46.847.000 S7 207.000 40.909 000 15.121.000 958.983.000 -234.000.000 188.800.000 74.550.000 74.559.000 114.337.000 177,974.000 900.000.000 -73.803,000 1.965.030.000 46,970.000 100.963.000 32.247.000 32.247.000 68.706.000 96.751.000 1.772.650.000 -52.20.000 net statement of cash flow for the year 2018 - 2016 Name 2018 Cash Flow from Operating Activities. Indirect -2.680.478.000 Net Cash Flow from Continuing Operating Activities. Indirect 2.580.479.000 Cash Generated from Operating Activities 10.362.958.000 Income Loss before Non-Cash Adjustment 1.211.242.000 Total Adjustments for Non-Cash Items 7.858.000.000 Depreciation, Amortization and Depletion Non-Cash Adjustment 7.656.457.000 Depreciation and Amortization, Non-Cash Adjustment 7,656.457.000 Depreciation Non-Cash Adjustment 83.157.000 Amortization, Non-Cash Adjustment 7573 300 000 Stock-Based Compensation, Non-Cash Adjustment 320.657.000 Twe, Non-Cash Adjustment 85.520.000 Net Investment Income/Loss, Non-Cash Adjustment -73.950.000 Net Foreign Exchange Gain Loss, Non-Cash Adjustment -73.950.000 Gair Loss on Financial Instruments, Non-Cash Adjustment Other Non-Cash Items 40.428.000 Excess Tax Benefit from Stock-Based Compensation, Non-Cash Adjustme Irregular Income Loss, Non-Cash Adjustment Gain Loss on Extinguishment of Debt, Non-Cash Adjustment Gain/Loss on Disposals. Non-Cash Adjustment Gain/Loss on Disposal/Sale of Fixed Assets, Non-Cash Adjustment Gain/Loss on Disposal/Sale of Business, Non-Cash Adjustment Gain Loss on Disposal/Sale of Other Assets, Non-Cash Adjustment Amortization of Securities, Non-Cash Adjustment Changes in Operating Capital 1.283.647 000 Change in Other Current Assets 200. 192.000 Change in Payables and Accrued Expenses 349.620.000 Change in Trade and Other Payables 199.190.000 Change in Trade/Accounts Payable 199.198.000 Change in Accrued Expenses 150.422.000 Change in Deferred Assets/Libilities 142.277.000 Change in Other Current Liabilities 990. 80.000 Change in Other Operating Capital 2.062.000 Change in Prepayments and Deposits Other Operating Cash Flow -13.043.437 000 Cash Flow from Investing Activities -339, 120.000 Cash Flow from Continuing Investing Activities -339, 120.000 Purchase/ Sale and Disposal of Property. Plant and Equipment, Net - 173.000 Purchase of Property. Plant and Equipment - 173.986.000 Sale and Disposal of Property. Plant and Equipment Purchase/Sale of Investments, Net Purchase of investments OF Sale of Investments Purchase/Sale of Other Non-Current Assets, Net - 126.583.000 Purchase/Sale of Intangibles. Net -38.580.000 Purchase of Intangibles -38.586.000 Purchase/Sale of Business, Net Sale of Business Purchase/Acquisition of Business Other Investing Cash Flow Cash Flow from Financing Activities 4,048.527.000 Cash Flow from Continuing Financing Activities 4.048 527.000 Issuance of Payments for Common Stock, Net 124502.000 Proceeds from Issuance of Common Stock 124.502.000 Payments for Common Stock Issuance of/Repayments for Debt, Net 3.961.852.000 Issuance od Repayments for Long Term Debt, Net 3.961.852.000 Proceeds from Issuance of Long Term Debt 3.901.852.000 Repayments for Long Term Debt Issuance of/Repayments for Short Term Debt, Net Proceeds from Issuance of Short Term Debt Repayments for Short Term Debe Issue and Financing Costs -35.871.000 Debt Issuance costs Other Financing Cash Flow Excess Tax Benefit from Share-Based Compensation, Financing Activities Issuance of/Repayments for Lease Financing Repayments for Lease Financing Cash and Cash Equivalents, End of Period 3.812.041.000 Change in Cash 1.028.928,000 Effect of Exchange Rate Changes Cash and Cash Equivalents, Beginning of Period 2.822.795.000 Change in Cash As Reported. Supplemental 989.245.000 Income Tax Paid. Supplemental -131.000.000 Interest Paid, Supplemental 375.831.000 Total Net Change in Cash Fiscal year ends in Dec 31 USD -9.805.763.000 34 320.000 34.329,000 -173.302.000 -173.302.000 8.653.286.000 49.765.000 49.765.000 -107.653.000 - 107.653.000 F 258.040,000 -74.819.000 342.850.000 6.689.000 -53.720.000 53.720,000 235, 536.000 -187.190.000 422.729.000 -941.000 -77.177.000 -77,177,000 F F 3.076.900.000 3.076,990,000 88.378,000 88.378,000 1.091.630.000 1,091,630.000 36.979.000 36,979,000 3.020.510,000 3.020.510,000 3.020.510.000 1.000.000.000 1,000,000,000 1.000.000.000 -32.153,000 -10.700.000 255.000 230.000 65. 121.000 F 2.822.795,000 1.325, 371,000 29.848 000 1.467,578,000 1.356.219.000 -113.501.000 -213313.000 1.467.576.000 -332.589.000 -9.165.000 1,809, 330.000 341.754.000 -138.566.000 2017 1902 7.0 74.000 2.002.795.000 20200 2014 135 610 000 5720 201 000 2000 1467 50.000 0" 200 200 000 11 13 4M 1.000 11.32.768.000 319.404.000 642.000 270.9.000 1998 500 000 7.08.319.000 250.395.000 5 B04000 148 620.000 23 0681000 229 88.000 13.572.000 0681000 107 945.000 102.337.000 32.185.000 70.152.000 108.295.000 185 35.000 49.217.000 300.000 50.318.000 6.267.000 2230 000 -321.814.000 21814.000 10:371055.000 10.371055.000 10:31.055.000 10:371055.000 652 300 000 294 209.000 7274.501.000 7274.501.000 721401.000 7214.501 000 341423.000 1 2 for the year 2018 - 2010 4 204 5 Total 25904400 Total Current Assets 9.60 15.000 Cash Cash Equivalents and Short Term Trivestments 3.79140.000 Cash and Ch queres 3.70 2.572685.000 Cash Eques 1221.790.000 Short Term nemor Trade and Other Receivables, Current Trades Account Recovei, Current 14 Other Receive Current Prepayments and Deposits. Current Cr Asts | 51.000 17 Total Non Current 18.280 2800 Net Property. Part and Equipment 418.281.000 10 Cross Property, Pantand Equipment 700 000 Properties 381.21.000 Land and improvements 0.125.000 Buildings and improve 73 Loretold and provenient 282.com Machinery, Furniture and Equipment 18135.00 Part and Machinery 1.800.000 Furniture Fixtures and Office Equipment Flight Fleet Veride and Related Equipment Other Equipment 53.416.000 Construction in Progress and Advance Parts 19.548.000 Other Property Part and Equipment 225.000 Accumulated Depreciation and impairment 368 519.000 Acounted Depreciation 08.510.000 Netragble Asset 14.00 Gross Goodwill and Other Intangible Assets 14.960 640 Intybiersther than Goodwill 1490 Other Ingible Assets 140 68.000 Other Non Current 901 con Deferred Tax Assets Non-Current Deferred Contrast, Non Current 40 Total des 20.735.695.000 1 640000" Payales and Accrued Experts, Current 1,040.400 000 Trade and Paysles. Current 562 .." Trade Accounts Payabile. Current 55.000 45 Accrued Expenses. Current 477,417,000 Deard , Deferred Income Customer Advancing in Earl 780.800.000 Other Current Liabilities 468 019.000 Financial Life Current Current Debt and Capital Laste Obligation Current Portion of Long Term Debt and Capital Les Capital Lease Obligations. Current Provision Current Provision for Employee Eifers. Current Ta Na 140315.000 Financial Liabile. Non Current 10.300.000 Long Term Debt and Capital Cligion 10.300.000 Long Term Delt 100 Borrowings from Associates and Related Parties 0 Other Loans Non-Current Capital Lame Obligation. Non Current Other Non-Current Liabilities Totally 52.000 64 Equity Aribute to Port Stockholders 5.230.705.000 Paidin Cod 2315.968.000 Capital Sock 2,315.00 Common Stock 2.315 000 Common Stock, with Par Value Preferred Stock o 70 Additional Paidin Capital Share Premium 71 Retained Earnings Accumulated Delicit 291238.000 72 Reserve Accumdated Compreensive Incomalo - 10 50000 73 Common Shares issued 438 Commons Ong SSR Common Share Treasury OP 70 Fiscal year andsin De 31 USO 15.430 73.000 5.312.000 6 549.000 359.555.000 350.500.000 315.094.000 018.622.000 61.002.000 4.173.0000 10.903.310.000 459357000 510.414.000 312.302.000 312.02.000 197.632.000 64.472.000 3472.000 3.632711.000 954000 6.400 42.000 8.499 222.000 12 000 3354311.000 2.3214311.000 3.35.311.000 3.465.002.000 3.50 000 3.58100 1871.39.000 17.000 11871 3000 2.956.162.000 2679.100.000 2679 800.000 1.599./12.000 1599 000 1.599.782.000 o' 0 731117.000 20557000 433.392. 1121.000.000 48.585.000 430.054 212 00054212 0 0