

Question
What is so amazing about this product, said C. Drake, CEO of Live-A-Life Foundation, is that it has the potential to change the world. And
What is so amazing about this product, said C. Drake, CEO of Live-A-Life Foundation, is that it has the potential to change the world. And his speech on the launch of the product continued. This new product had been in the making for a very long time.
Live-A-Life to do investment evaluation Live-A-Life Foundation, despite its name, was a for-profit business. And it had been a very profitable company, not least because Drake had demonstrated to be a genius and found a way to treat some form of cancer. Riding on its past success, the company wanted to introduce a product the product that could be rolled out to consumers, revolutionalising the way we live. In the senior management that went a while back, one of Drakes brightest scientists in the team, D. Skirth, put forward the possibility of such a product. The question was whether economically, it would be beneficial to the Live-A-Life Foundation. It was necessary to conduct an investment assessment exercise. Indeed, to assist the decision-making, a full test-and-trial study of $1 million was commissioned and completed for the purpose beforehand.
Details to delight
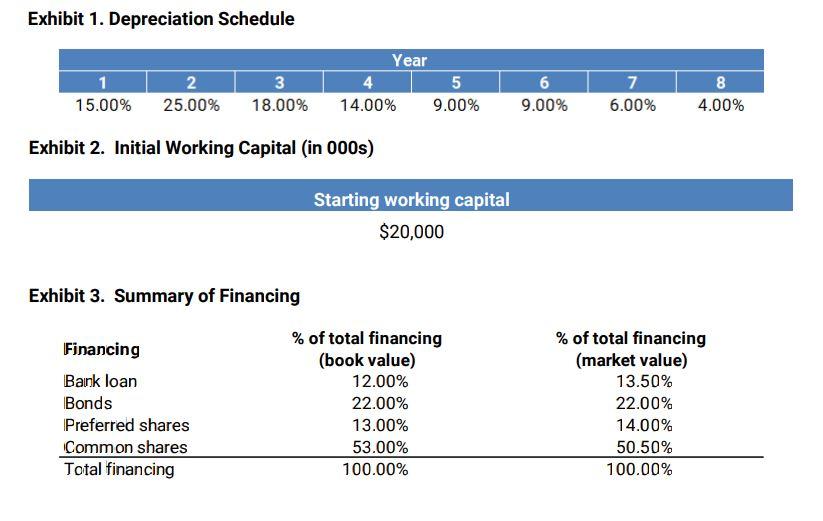
The first year of selling the product on the market would be 2022 (assuming we are in January 2021), with the initial investment of $540 million to be fully made in the year before. Since competition was expected to become lethally severe in this space, the project would only last 8 years, after which Live-A-Life Foundation would close it down. (For simplicity, assume that at the end of the eighth year, there would be no salvage value. The depreciation schedule could be found in exhibit 1. The corporate tax would be 38%. The product was forecasted to achieve a revenue of $250 million in the first year. It would grow at the following rates in each of the following years: 13.0%, 11.0%,10.0%, 8.0%, 6.0%, 4.0% and 2.0%. There were two categories of costs: Production costs and servicing costs. Production costs would be 52.0%, 50.0%, 43.0%, 42.0%, 41.0%, 40.0%, 39.0% and 39.0% of the annual turnover. One the other hand, servicing costs accounted for 7% of the annual revenues in the first four years. In the four years that follow, maintenance costs would increase to 11% of the annual revenues.
The working capital of the project would come across to many as bizarre. First, it would start immediately and the amount was shown in exhibit 2. It would then double [i.e. go up by 100%] in the following 2 years [i.e. double and then double again]. In the subsequent year, the amount of working capital to be tied up would go up by another 40 percent. The total amount of working capital would then remain unchanged for three years. In the year that followed, the amount would come down by 20 percent. It would then, again, go down by another 10 percent in the year after. Recovery would only take place in the year after the end of the entire project.
Live-A-Life Foundation was financed by bank loan, bonds, preferred shares and common shares, the details of their proportions are shown in exhibit 3. The companys bank charged interest at 7.0%. The bond that was issued had a 5-year maturity, with a coupon rate of 5.00%, a face value of each bond is $71.00 and the total amount gained from selling each bond was $60.00. The current price of a common share is $22.00 and it just paid a dividend of $1.92. The company is expected to grow the dividend at a fixed rate of 2% every year forever. Furthermore, the current trading price of the preferred share is $32.00 and pays an annual dividend of $3.00. All in all, Drake was excited about the possibility of talking about a new revolutionary product and hoped that it would also be economically sound.
1. Your task is to use the information in the case to decide whether this project is worth undertaking. You can submit up to two worksheets in one spreadsheet file showing:
All assumptions
(Projected) profit and loss (all the way up to EBIT)
(Projected) free cash flow analysis
Calculation of WACC you will need to spend a bit of time figuring out how to calculate the cost of the different financing means
Calculation of NPV
Calculation of IRR
Exhibit 1. Depreciation Schedule 1 15.00% 2 25.00% 3 18.00% Year 4 5 14.00% 9.00% 6 9.00% 7 6.00% 8 4.00% Exhibit 2. Initial Working Capital (in 000s) Starting working capital $20,000 Exhibit 3. Summary of Financing Financing Bank loan Bonds Preferred shares Common shares Total financing % of total financing (book value) 12.00% 22.00% 13.00% 53.00% 100.00% % of total financing (market value) 13.50% 22.00% 14.00% 50.50% 100.00% Exhibit 1. Depreciation Schedule 1 15.00% 2 25.00% 3 18.00% Year 4 5 14.00% 9.00% 6 9.00% 7 6.00% 8 4.00% Exhibit 2. Initial Working Capital (in 000s) Starting working capital $20,000 Exhibit 3. Summary of Financing Financing Bank loan Bonds Preferred shares Common shares Total financing % of total financing (book value) 12.00% 22.00% 13.00% 53.00% 100.00% % of total financing (market value) 13.50% 22.00% 14.00% 50.50% 100.00%Step by Step Solution
There are 3 Steps involved in it
Step: 1

Get Instant Access to Expert-Tailored Solutions
See step-by-step solutions with expert insights and AI powered tools for academic success
Step: 2

Step: 3
Ace Your Homework with AI
Get the answers you need in no time with our AI-driven, step-by-step assistance
Get Started
The Best Retirement Guides For Adults Successful Techniques To Make Your Money Last A Lifetime
Authors: Rebecca W. Anderson
1st Edition
979-8865146025