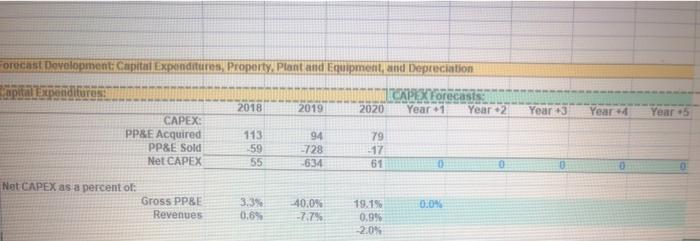
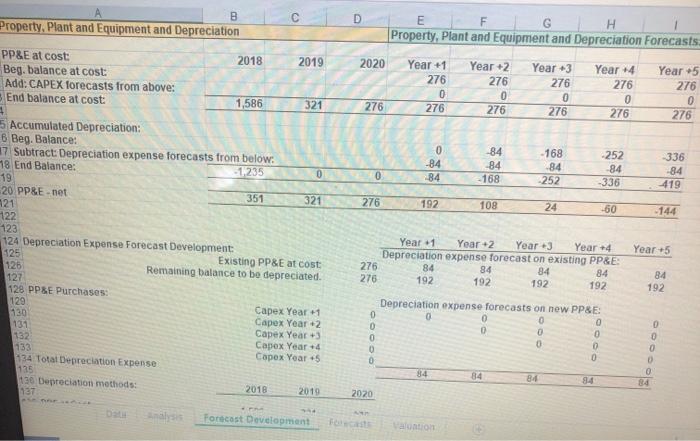
what is the CAPEX forcast for GameStop for the next five years
orecast Development: Capital Expenditures, Property. Plant and Equipment, and Depreciation Capital Expenditures BRUTALOOLINELE ALLA CAPEXForecasts 2018 2019 2020 Year.1 Year 2 CAPEX: PP&E Acquired 113 94 79 PP&E Sold -728 -17 Net CAPEX 55 -634 61 Year 3 Year 4 Year 5 59 Net CAPEX as a percent of: Gross PPBE Revenues 3.3% 0.6% 0.0% -40.09 -2.7% 19.15 0.9% 2.0% B Property, Plant and Equipment and Depreciation 2018 2019 PP&E at cost: Beg. balance at cost: Add: CAPEX forecasts from above: 3 End balance at cost: D F G Property, Plant and Equipment and Depreciation Forecasts 2020 Year +1 Year +2 Year 3 Year -4 Year 5 276 276 276 276 276 0 0 0 0 276 276 276 276 276 276 1,586 321 0 -84 84 84 84 - 168 -168 84 -252 -252 84 -336 -336 84 419 0 276 192 108 24 -50 -144 Year +5 5 Accumulated Depreciation: 6 Beg. Balance: 17 Subtract: Depreciation expense forecasts from below: 18 End Balance: -1235 0 19 20 PP&E.net 351 321 21 122 123 124 Depreciation Expense Forecast Development 125 Existing PP&E at cost 125 Remaining balance to be depreciated. 127 128 PPSE Purchases 129 Capex Year +1 130 Capex Year 2 131 132 Capex Year +3 133 Capex Year 4 134 Total Depreciation Expense Capex Year 5 125 120 Depreciation methods: 2018 2019 137 Year +1 Year 2 Year 3 Year +4 Depreciation expense forecast on existing PP&E: 276 84 84 84 84 276 192 192 192 192 84 192 Depreciation expense forecasts on new PP&E: 0 0 O 0 0 0 0 0 0 0 0 0 0 0 84 84 84 0 0 0 84 2020 Forecast Development orecast Development: Capital Expenditures, Property. Plant and Equipment, and Depreciation Capital Expenditures BRUTALOOLINELE ALLA CAPEXForecasts 2018 2019 2020 Year.1 Year 2 CAPEX: PP&E Acquired 113 94 79 PP&E Sold -728 -17 Net CAPEX 55 -634 61 Year 3 Year 4 Year 5 59 Net CAPEX as a percent of: Gross PPBE Revenues 3.3% 0.6% 0.0% -40.09 -2.7% 19.15 0.9% 2.0% B Property, Plant and Equipment and Depreciation 2018 2019 PP&E at cost: Beg. balance at cost: Add: CAPEX forecasts from above: 3 End balance at cost: D F G Property, Plant and Equipment and Depreciation Forecasts 2020 Year +1 Year +2 Year 3 Year -4 Year 5 276 276 276 276 276 0 0 0 0 276 276 276 276 276 276 1,586 321 0 -84 84 84 84 - 168 -168 84 -252 -252 84 -336 -336 84 419 0 276 192 108 24 -50 -144 Year +5 5 Accumulated Depreciation: 6 Beg. Balance: 17 Subtract: Depreciation expense forecasts from below: 18 End Balance: -1235 0 19 20 PP&E.net 351 321 21 122 123 124 Depreciation Expense Forecast Development 125 Existing PP&E at cost 125 Remaining balance to be depreciated. 127 128 PPSE Purchases 129 Capex Year +1 130 Capex Year 2 131 132 Capex Year +3 133 Capex Year 4 134 Total Depreciation Expense Capex Year 5 125 120 Depreciation methods: 2018 2019 137 Year +1 Year 2 Year 3 Year +4 Depreciation expense forecast on existing PP&E: 276 84 84 84 84 276 192 192 192 192 84 192 Depreciation expense forecasts on new PP&E: 0 0 O 0 0 0 0 0 0 0 0 0 0 0 84 84 84 0 0 0 84 2020 Forecast Development