

Answered step by step
Verified Expert Solution
Question
1 Approved Answer
What is the debt-to equity ratio for the below information? Appendix 2. Mattel, Inc., Consolidated Balance Sheet, 1996-2003 (millions of US$) 1996 1997 1998 1999
What is the debt-to equity ratio for the below information?
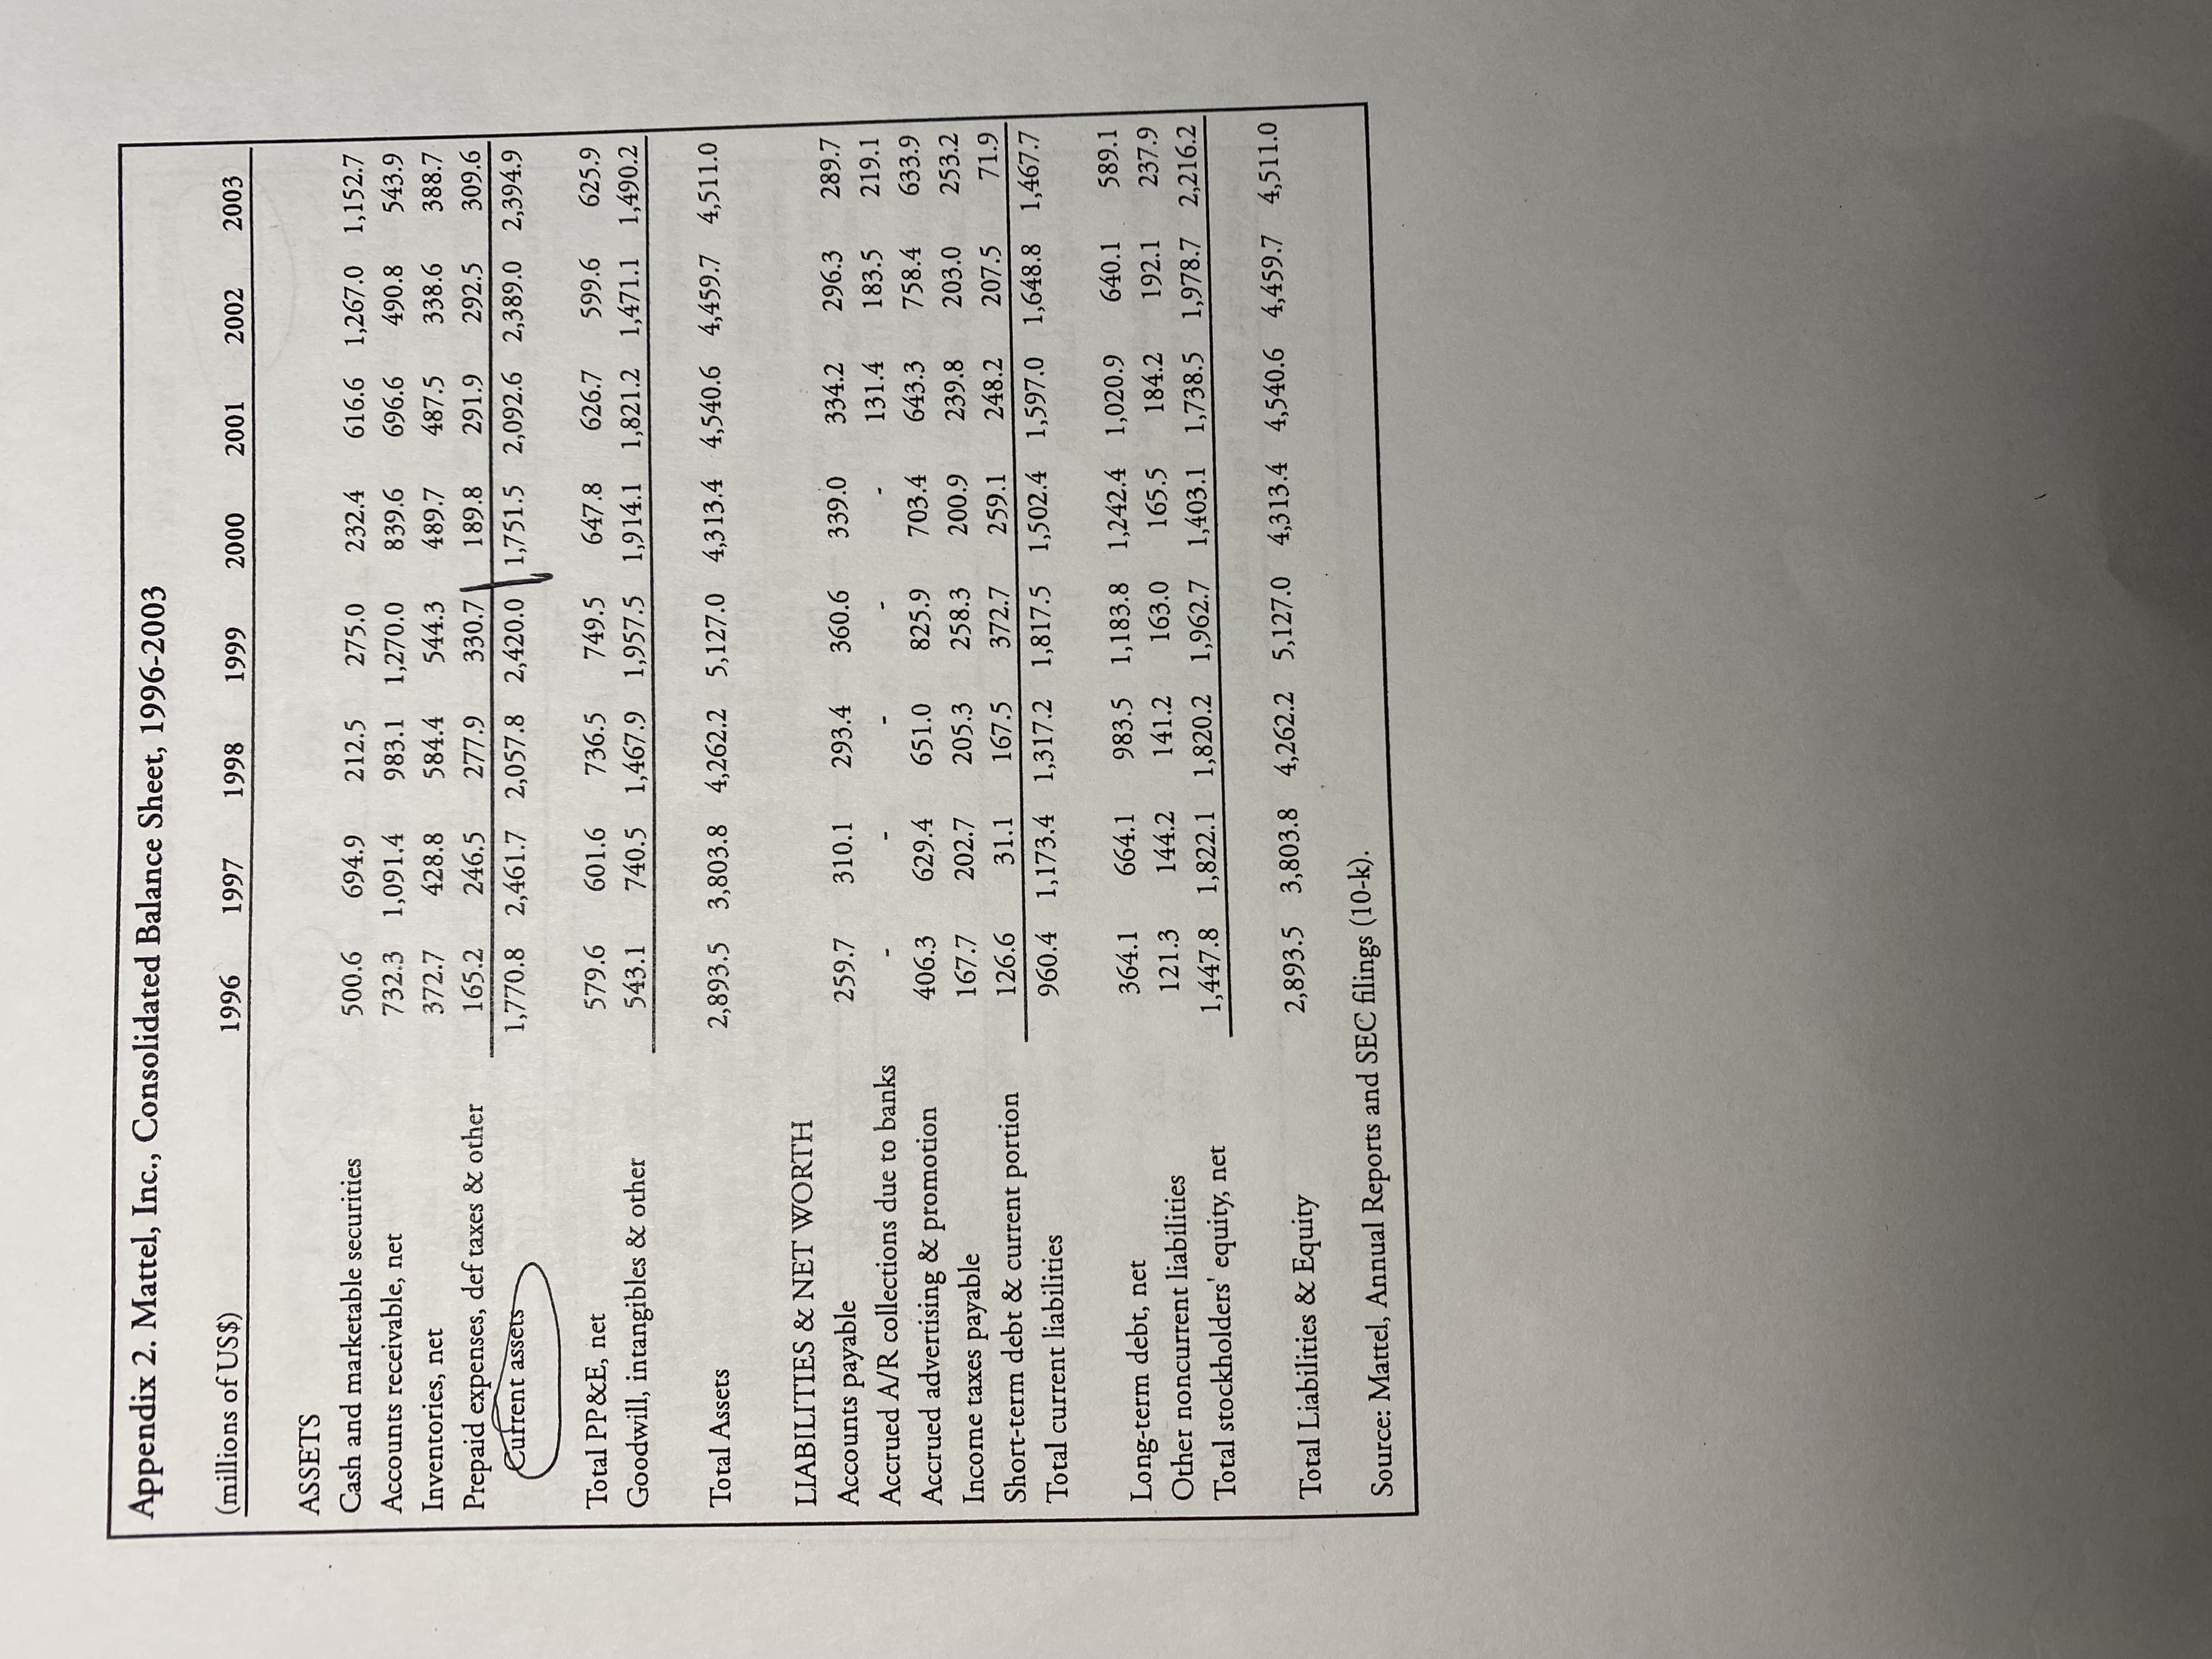
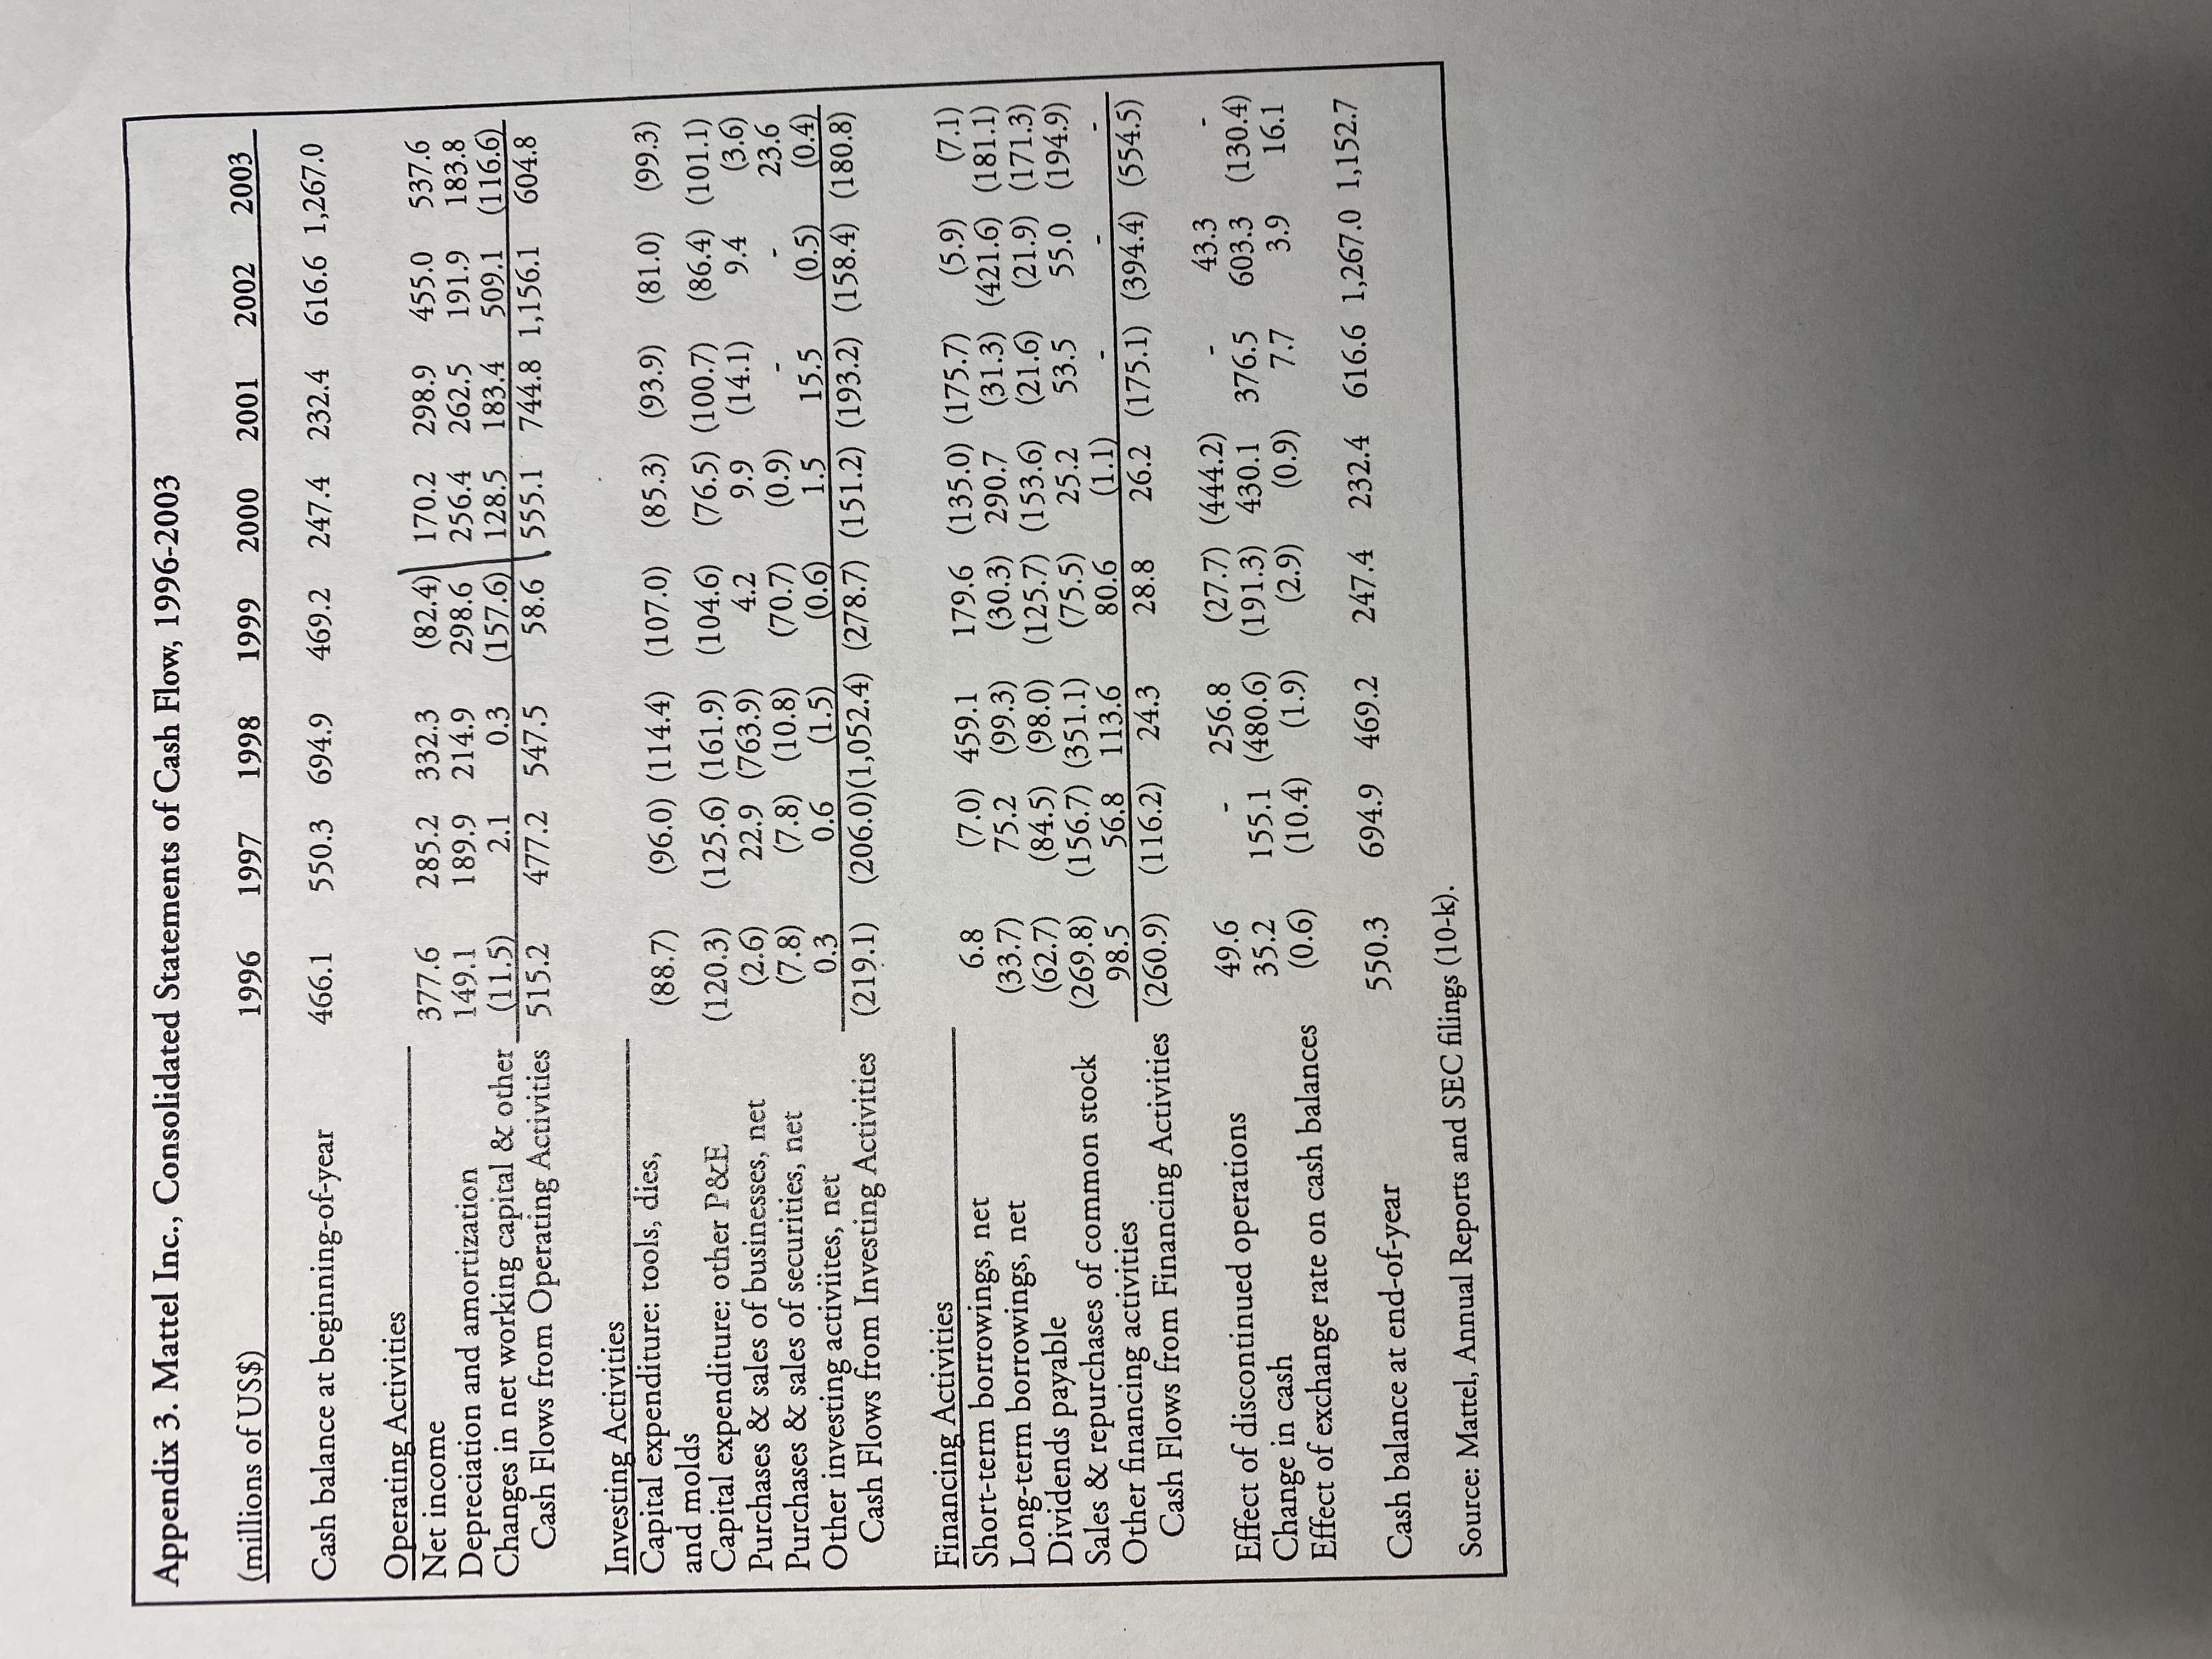
Appendix 2. Mattel, Inc., Consolidated Balance Sheet, 1996-2003 (millions of US\$) 1996 1997 1998 1999 2000 2001 2002 2003 ASSETS Cash and marketable securities Accounts receivable, net Inventories, net Prepaid expenses, def taxes & other eurrent assets Total PP\&E, net Goodwill, intangibles \& other Total Assets \begin{tabular}{rrrrrrrr} 500.6 & 694.9 & 212.5 & 275.0 & 232.4 & 616.6 & 1,267.0 & 1,152.7 \\ 732.3 & 1,091.4 & 983.1 & 1,270.0 & 839.6 & 696.6 & 490.8 & 543.9 \\ 372.7 & 428.8 & 584.4 & 544.3 & 489.7 & 487.5 & 338.6 & 388.7 \\ 165.2 & 246.5 & 277.9 & 330.7 & 189.8 & 291.9 & 292.5 & 309.6 \\ \hline 1,770.8 & 2,461.7 & 2,057.8 & 2,420.0 & 1,751.5 & 2,092.6 & 2,389.0 & 2,394.9 \\ & & & & & & & \\ 579.6 & 601.6 & 736.5 & 749.5 & 647.8 & 626.7 & 599.6 & 625.9 \\ 543.1 & 740.5 & 1,467.9 & 1,957.5 & 1,914.1 & 1,821.2 & 1,471.1 & 1,490.2 \\ \hline & & & & & & & \\ 2,893.5 & 3,803.8 & 4,262.2 & 5,127.0 & 4,313.4 & 4,540.6 & 4,459.7 & 4,511.0 \end{tabular} LIABILITIES \& NET WORTH Accounts payable Accrued A/R collections due to banks Accrued advertising \& promotion Income taxes payable Short-term debt & current portion Total current liabilities Long-term debt, net Other noncurrent liabilities Total stockholders' equity, net Total Liabilities \& Equity \begin{tabular}{rrrrrrrr} 259.7 & 310.1 & 293.4 & 360.6 & 339.0 & 334.2 & 296.3 & 289.7 \\ - & - & - & - & - & 131.4 & 183.5 & 219.1 \\ 406.3 & 629.4 & 651.0 & 825.9 & 703.4 & 643.3 & 758.4 & 633.9 \\ 167.7 & 202.7 & 205.3 & 258.3 & 200.9 & 239.8 & 203.0 & 253.2 \\ 126.6 & 31.1 & 167.5 & 372.7 & 259.1 & 248.2 & 207.5 & 71.9 \\ \hline 960.4 & 1,173.4 & 1,317.2 & 1,817.5 & 1,502.4 & 1,597.0 & 1,648.8 & 1,467.7 \end{tabular} Source: Mattel, Annual Reports and SEC filings (10-k). \begin{tabular}{|c|c|c|c|c|c|c|c|c|} \hline \multicolumn{9}{|c|}{ Appendix 3. Mattel Inc., Consolidated Statements of Cash Flow, 1996-2003 } \\ \hline (millions of US\$) & 1996 & 1997 & 1998 & 1999 & 2000 & 2001 & 2002 & 2003 \\ \hline Cash balance at beginning-of-year & 466.1 & 550.3 & 694.9 & 469.2 & 247.4 & 232.4 & 616.61 & 1,267.0 \\ \hline \multicolumn{9}{|l|}{ Operating Activities } \\ \hline Net income & 377.6 & 285.2 & 332.3 & (82.4) & 170.2 & 298.9 & 455.0 & 537.6 \\ \hline Depreciation and amortization & 149.1 & 189.9 & 214.9 & 298.6 & 256.4 & 262.5 & 191.9 & 183.8 \\ \hline Changes in net working capital & other & (11.5) & 2.1 & 0.3 & (157.6) & 128.5 & 183.4 & 509.1 & (116.6) \\ \hline Cash Flows from Operating Activities & 515.2 & 477.2 & 547.5 & 58.6 & 555.1 & 744.81 & 1,156.1 & 604.8 \\ \hline \multicolumn{9}{|l|}{ Investing Activities } \\ \hline Capital expenditure: tools, dies, & (88.7) & (96.0) & (114.4) & (107.0) & (85.3) & (93.9) & (81.0) & (99.3) \\ \hline Capital expenditure: other P\&E & (120.3) & (125.6) & (161.9) & (104.6) & (76.5) & (100.7) & (86.4) & (101.1) \\ \hline Purchases \& sales of businesses, net & (2.6) & 22.9 & (763.9) & 4.2 & 9.9 & (14.1) & 9.4 & (3.6) \\ \hline Purchases \& sales of securities, net & (7.8) & (7.8) & (10.8) & (70.7) & (0.9) & & 0,51 & 23.6 \\ \hline Other investing activiites, net & 0.3 & 0.6 & (1.5) & (0.6) & 1.5 & 15.5 & (0.5) & (0.4) \\ \hline Cash Flows from Investing Activities & (219.1) & (206.0)( & (1,052.4) & (278.7) & (151.2) & (193.2) & (158.4) & (180.8) \\ \hline \multicolumn{8}{|l|}{ Financing Activities } & (7.1) \\ \hline Short-term borrowings, net & & \begin{tabular}{l} (7.0) \\ 75.2 \end{tabular} & \begin{tabular}{l} 459.1 \\ (99.3) \end{tabular} & \begin{tabular}{l} 179.6 \\ (30.3) \end{tabular} & \begin{tabular}{l} (13).0) \\ 290.7 \end{tabular} & (31.3) & (421.6) & (181.1) \\ \hline \begin{tabular}{l} Long-term borrowings, net \\ Dividends payable \end{tabular} & \begin{tabular}{l} (33.7) \\ (62.7) \end{tabular} & (84.5) & (98.0) & (125.7) & (153.6) & (21.6) & (21.9) & (171.3) \\ \hline \begin{tabular}{l} Dividends payable \\ Sales \& repurchases of common stock \end{tabular} & (269.8) & (156.7) & (351.1) & (75.5) & 25.2 & 53.5 & 55.0 & (194.9) \\ \hline Other financing activities & 98.5 & 56.8 & 113.6 & 80.6 & (1.1) & - & - & - \\ \hline Cash Flows from Financing Activities & (260.9) & (116.2) & 24.3 & 28.8 & 26.2 & (175.1) & (394.4) & (554.5) \\ \hline Effect of discontinued operations & 49.6 & - & 256.8 & (27.7) & (444.2) & & 43.3 & 10 \\ \hline Change in cash & 35.2 & 155.1 & (480.6) & (191.3) & 430.1 & 376.5 & 603.3 & (130.4) \\ \hline Effect of exchange rate on cash & (0.6) & (10.4) & (1.9) & & & & 3.9 & \\ \hline Cash balance at end-of-year & 550.3 & 694.9 & 469.2 & 247.4 & 232.4 & 616.6 & 1,267.0 & 1,152.7 \\ \hline \end{tabular}
Step by Step Solution
There are 3 Steps involved in it
Step: 1

Get Instant Access to Expert-Tailored Solutions
See step-by-step solutions with expert insights and AI powered tools for academic success
Step: 2

Step: 3
Ace Your Homework with AI
Get the answers you need in no time with our AI-driven, step-by-step assistance
Get Started
Financial Accounting
Authors: David Spiceland, Wayne M. Thomas, Don Herrmann
5th edition
1259914895, 978-1259914898