What is the Enterprise Value for Dollar General 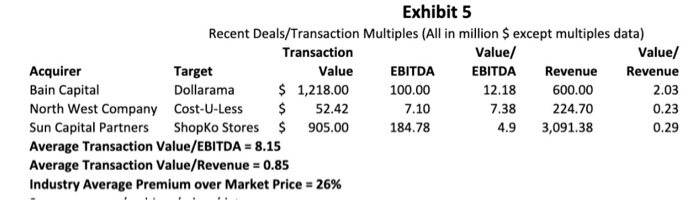
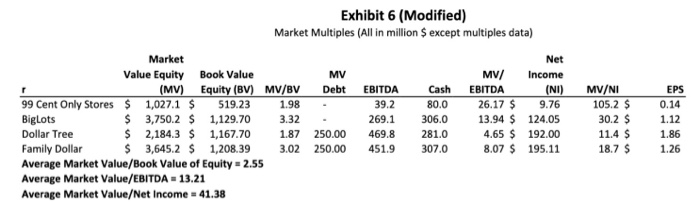
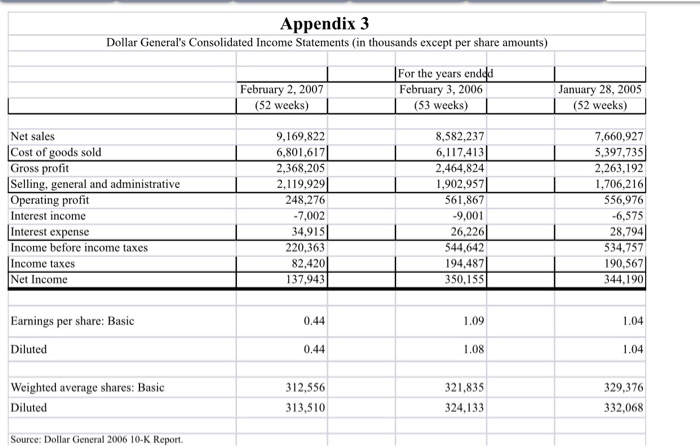
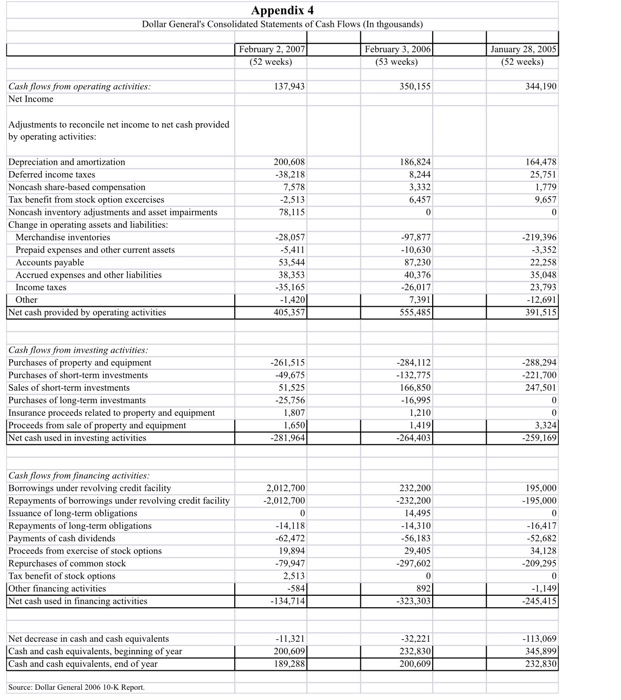
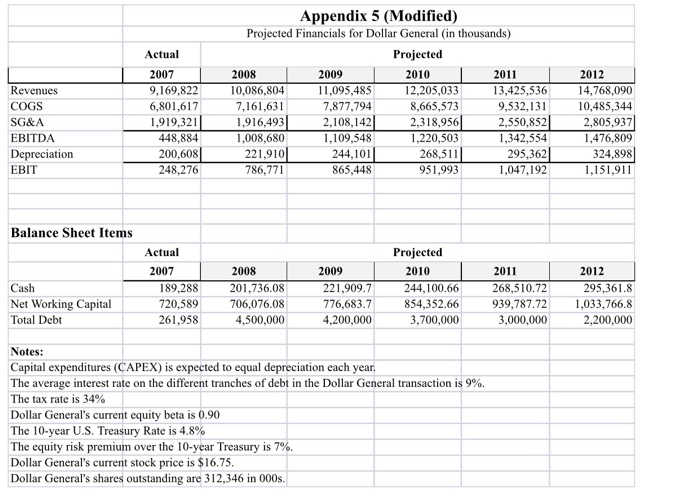
40 Exhibit 5 Recent Deals/Transaction Multiples (All in million $ except multiples data) Transaction Value/ Value Acquirer Target Value EBITDA EBITDA Revenue Revenue Bain Capital Dollarama $ 1,218.00 100.00 12.18 600.00 2.03 North West Company Cost-U-Less $ 52.42 7.10 224.70 0.23 Sun Capital Partners Shopko Stores $ 905.00 184.78 4. 9 3,091.38 0.29 Average Transaction Value/EBITDA = 8.15 Average Transaction Value/Revenue = 0.85 Industry Average Premium over Market Price = 26% 7.38 Exhibit 6 (Modified) Market Multiples (All in million $ except multiples data) Market Value Equity Book Value (MV) Equity (BV) MV/BV 99 Cent Only Stores $ 1,027.1 $ 519.23 1.98 Biglots $ 3,750.2 $ 1,129.70 3.32 Dollar Tree $ 2,184.3 $ 1,167.70 1.87 Family Dollar $ 3,645.2 $ 1,208.39 3.02 Average Market Value/Book Value of Equity - 2.55 Average Market Value/EBITDA - 13.21 Average Market Value/Net Income = 41.38 MV Debt - - 250.00 250.00 EBITDA 39.2 269.1 469.8 451. 9 Cash 80.0 306.0 281.0 3 07.0 MV/ EBITDA 26.17 $ 13.94 $ 4.65 $ 8.07 $ Net Income (NI) 9.76 124.05 192.00 195.11 MV/NI 105.2 $ 30.2 $ 11.4 $ 18.7 $ EPS 0.14 1.12 1.86 1.26 Appendix 3 Dollar General's Consolidated Income Statements in thousands except per share amounts) February 2, 2007 (52 weeks) For the years enddd February 3, 2006 (53 weeks) January 28, 2005 (52 weeks) Net sales Cost of goods sold Gross profit Selling, general and administrative Operating profit Interest income Interest expense Income before income taxes Income taxes Net Income 9,169,822 6,801,6171 2,368,205 2,119,9291 248,276 -7,002 34,9151 220,363 82,420 137,943 8,582,237 6,117,4131 2,464,824 1,902,9571 561,867 -9,001 26,226 544,642 194,487 350,155 7,660,927 5,397,735 2,263,192 1,706,216 556,976 -6,575 28,794 534,757 190,567 344,190 Earnings per share: Basic 0.44 1.09 1.04 Diluted 0.44 1.08 1.04 Weighted average shares: Basic Diluted 312,556 313,510 321,835 324,133 329,376 332,068 Source: Dollar General 2006 10-K Report Appendix 4 Dollar General's Consolidated Statements of Cash Flows (In thgousands) February 2, 2007 February 3, 2006 (53 weeks) January 28, 2005 (52 weeks) 137.943 350.155 344,190 Cash flows from operating activities: Net Income Adjustments to reconcile net income to net cash provided by operating activities: 200.608 -38,218 7.578 -2,513 78,115 186,824 8.244 3,332 6,457 164.478 25.751 1.779 9.657 Depreciation and amortization Deferred income taxes Noncash share-based compensation Tax benefit from stock option excercises Noncash inventory adjustments and asset impairments Change in operating assets and liabilities: Merchandise inventories Prepaid expenses and other current assets Accounts payable Accrued expenses and other liabilities Income taxes Other Net cash provided by operating activities -28,057 -5.411 53.544 38,353 -35,165 -1.4201 405,3571 -97.877 -10.630 87.230 40,376 26.017 7,3911 555.485 -219.396 -3,352 22.258 35,048 23,793 -12,691 391,515 1 -288.294 -221,700 247,501 Cash flows from investing activities: Purchases of property and equipment Purchases of short-term investments Sales of short-term investments Purchases of long-term investmants Insurance proceeds related to property and equipment Proceeds from sale of property and equipment Net cash used in investing activities -261,515 -49,675 51,525 -25,756 1.807 1.650 -281,9641 -284.112 -132.775 166,850 -16.995 1.210 1,4191 -264,4031 3.3241 -259,1691 2,012,700 -2.012,700 195,000 -195.000 Cash flows from financing activities: Borrowings under revolving credit facility Repayments of borrowings under revolving credit facility Issuance of long-term obligations Repayments of long-term obligations Payments of cash dividends Proceeds from exercise of stock options Repurchases of common stock Tax benefit of stock options Other financing activities Net cash used in financing activities -16,417 232,200 -232,200 14,495 -14.310 -56,183 29,405 -297,602 - 14.118 -62.472 19.894 -79.947 2.513 -584 -134,714 -52.682 34,128 -209,295 0 8921 -1.149 -245,415 -323,3031 Net decrease in cash and cash equivalents Cash and cash equivalents, beginning of year Cash and cash equivalents, end of year -11,321 200,609 189,288 -32,221 232,830 200, 6091 -113,069 345,899 32.830 2 Source: Dollar General 2006 10-K Report Actual Revenues COGS SG&A EBITDA Depreciation EBIT 2007 9,169,822 6,801,617 1,919,321 448,884 200,608 248,276 Appendix 5 (Modified) Projected Financials for Dollar General (in thousands) Projected 2008 2009 2010 2011 10,086,804 11,095,485 12,205,033 13,425,536 7,161,631 7,877,794 8,665,573 9,532,131 1,916,493 2,108,142 2,318,956 2,550,852 1,008,680 1,109,548 1,220,503 1,342,554 221,910 244,101 268,511 295,362 786,771 865,448 951,993 1,047,192 2012 14,768,090 10,485,344 2,805,937 1,476,809 324,898 1,151,911 Balance Sheet Items Cash Net Working Capital Total Debt Actual 2007 189,288 720,589 261,958 2008 201,736.08 706,076.08 4,500,000 2009 221,909.7 776,683.7 4,200,000 Projected 2010 244,100.66 854,352.66 3,700,000 2011 268,510.72 939.787.72 3,000,000 2012 295,361.8 1.033.766.8 2.200.000 Notes: Capital expenditures (CAPEX) is expected to equal depreciation each year. The average interest rate on the different tranches of debt in the Dollar General transaction is 9%. The tax rate is 34% Dollar General's current equity beta is 0.90 The 10-year U.S. Treasury Rate is 4.8% The equity risk premium over the 10-year Treasury is 7%. Dollar General's current stock price is $16.75. Dollar General's shares outstanding are 312,346 in 000s. 40 Exhibit 5 Recent Deals/Transaction Multiples (All in million $ except multiples data) Transaction Value/ Value Acquirer Target Value EBITDA EBITDA Revenue Revenue Bain Capital Dollarama $ 1,218.00 100.00 12.18 600.00 2.03 North West Company Cost-U-Less $ 52.42 7.10 224.70 0.23 Sun Capital Partners Shopko Stores $ 905.00 184.78 4. 9 3,091.38 0.29 Average Transaction Value/EBITDA = 8.15 Average Transaction Value/Revenue = 0.85 Industry Average Premium over Market Price = 26% 7.38 Exhibit 6 (Modified) Market Multiples (All in million $ except multiples data) Market Value Equity Book Value (MV) Equity (BV) MV/BV 99 Cent Only Stores $ 1,027.1 $ 519.23 1.98 Biglots $ 3,750.2 $ 1,129.70 3.32 Dollar Tree $ 2,184.3 $ 1,167.70 1.87 Family Dollar $ 3,645.2 $ 1,208.39 3.02 Average Market Value/Book Value of Equity - 2.55 Average Market Value/EBITDA - 13.21 Average Market Value/Net Income = 41.38 MV Debt - - 250.00 250.00 EBITDA 39.2 269.1 469.8 451. 9 Cash 80.0 306.0 281.0 3 07.0 MV/ EBITDA 26.17 $ 13.94 $ 4.65 $ 8.07 $ Net Income (NI) 9.76 124.05 192.00 195.11 MV/NI 105.2 $ 30.2 $ 11.4 $ 18.7 $ EPS 0.14 1.12 1.86 1.26 Appendix 3 Dollar General's Consolidated Income Statements in thousands except per share amounts) February 2, 2007 (52 weeks) For the years enddd February 3, 2006 (53 weeks) January 28, 2005 (52 weeks) Net sales Cost of goods sold Gross profit Selling, general and administrative Operating profit Interest income Interest expense Income before income taxes Income taxes Net Income 9,169,822 6,801,6171 2,368,205 2,119,9291 248,276 -7,002 34,9151 220,363 82,420 137,943 8,582,237 6,117,4131 2,464,824 1,902,9571 561,867 -9,001 26,226 544,642 194,487 350,155 7,660,927 5,397,735 2,263,192 1,706,216 556,976 -6,575 28,794 534,757 190,567 344,190 Earnings per share: Basic 0.44 1.09 1.04 Diluted 0.44 1.08 1.04 Weighted average shares: Basic Diluted 312,556 313,510 321,835 324,133 329,376 332,068 Source: Dollar General 2006 10-K Report Appendix 4 Dollar General's Consolidated Statements of Cash Flows (In thgousands) February 2, 2007 February 3, 2006 (53 weeks) January 28, 2005 (52 weeks) 137.943 350.155 344,190 Cash flows from operating activities: Net Income Adjustments to reconcile net income to net cash provided by operating activities: 200.608 -38,218 7.578 -2,513 78,115 186,824 8.244 3,332 6,457 164.478 25.751 1.779 9.657 Depreciation and amortization Deferred income taxes Noncash share-based compensation Tax benefit from stock option excercises Noncash inventory adjustments and asset impairments Change in operating assets and liabilities: Merchandise inventories Prepaid expenses and other current assets Accounts payable Accrued expenses and other liabilities Income taxes Other Net cash provided by operating activities -28,057 -5.411 53.544 38,353 -35,165 -1.4201 405,3571 -97.877 -10.630 87.230 40,376 26.017 7,3911 555.485 -219.396 -3,352 22.258 35,048 23,793 -12,691 391,515 1 -288.294 -221,700 247,501 Cash flows from investing activities: Purchases of property and equipment Purchases of short-term investments Sales of short-term investments Purchases of long-term investmants Insurance proceeds related to property and equipment Proceeds from sale of property and equipment Net cash used in investing activities -261,515 -49,675 51,525 -25,756 1.807 1.650 -281,9641 -284.112 -132.775 166,850 -16.995 1.210 1,4191 -264,4031 3.3241 -259,1691 2,012,700 -2.012,700 195,000 -195.000 Cash flows from financing activities: Borrowings under revolving credit facility Repayments of borrowings under revolving credit facility Issuance of long-term obligations Repayments of long-term obligations Payments of cash dividends Proceeds from exercise of stock options Repurchases of common stock Tax benefit of stock options Other financing activities Net cash used in financing activities -16,417 232,200 -232,200 14,495 -14.310 -56,183 29,405 -297,602 - 14.118 -62.472 19.894 -79.947 2.513 -584 -134,714 -52.682 34,128 -209,295 0 8921 -1.149 -245,415 -323,3031 Net decrease in cash and cash equivalents Cash and cash equivalents, beginning of year Cash and cash equivalents, end of year -11,321 200,609 189,288 -32,221 232,830 200, 6091 -113,069 345,899 32.830 2 Source: Dollar General 2006 10-K Report Actual Revenues COGS SG&A EBITDA Depreciation EBIT 2007 9,169,822 6,801,617 1,919,321 448,884 200,608 248,276 Appendix 5 (Modified) Projected Financials for Dollar General (in thousands) Projected 2008 2009 2010 2011 10,086,804 11,095,485 12,205,033 13,425,536 7,161,631 7,877,794 8,665,573 9,532,131 1,916,493 2,108,142 2,318,956 2,550,852 1,008,680 1,109,548 1,220,503 1,342,554 221,910 244,101 268,511 295,362 786,771 865,448 951,993 1,047,192 2012 14,768,090 10,485,344 2,805,937 1,476,809 324,898 1,151,911 Balance Sheet Items Cash Net Working Capital Total Debt Actual 2007 189,288 720,589 261,958 2008 201,736.08 706,076.08 4,500,000 2009 221,909.7 776,683.7 4,200,000 Projected 2010 244,100.66 854,352.66 3,700,000 2011 268,510.72 939.787.72 3,000,000 2012 295,361.8 1.033.766.8 2.200.000 Notes: Capital expenditures (CAPEX) is expected to equal depreciation each year. The average interest rate on the different tranches of debt in the Dollar General transaction is 9%. The tax rate is 34% Dollar General's current equity beta is 0.90 The 10-year U.S. Treasury Rate is 4.8% The equity risk premium over the 10-year Treasury is 7%. Dollar General's current stock price is $16.75. Dollar General's shares outstanding are 312,346 in 000s