What is the estimated growth rate of dividends from 2018-2020 to 2024-2026?
What are the dividends for the years 2021, 2022, and 2024-2026?
Using the dividend per share for 2021, 2022 and assuming that the dividend in 2023= dividend in 2024 -2026 and dividends have a constant growth starting in the year 2023. Estimate the value of your stocks on January 4th, 2021. You can use the required rate of return computed in question 18 for your calculations. (
Look up the market price for your stocks on January 4th,2021, and indicate if your stock was fairly priced, under-, or over-priced in the market. What action would you take to benefit from this disparity? If you feel that the market fairly priced your stock, discuss the possible reasons for your lack of faith in your analysis.
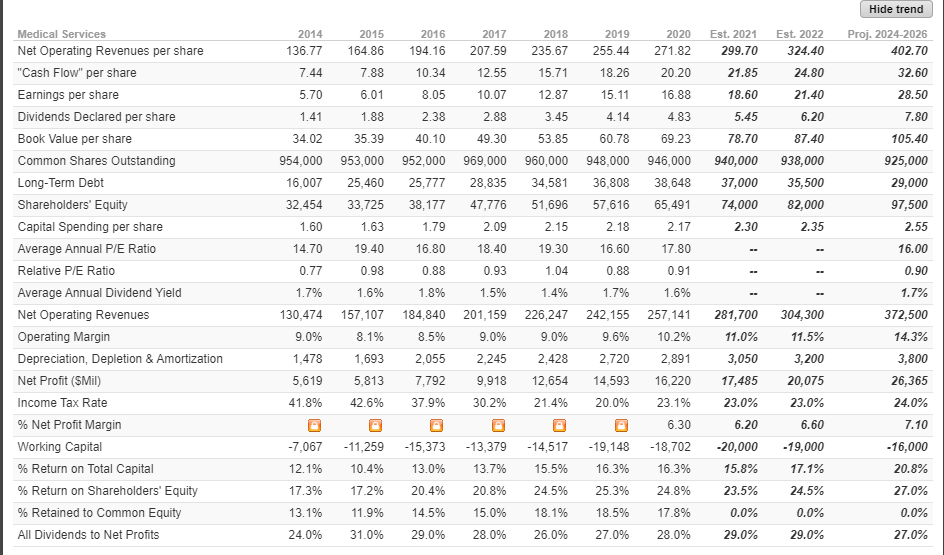
Hide trend 2014 2015 2016 2017 2018 2019 2020 Est. 2021 Est. 2022 Medical Services Net Operating Revenues per share Proj. 2024-2026 402.70 136.77 164.86 194.16 207.59 235.67 255.44 271.82 299.70 324.40 "Cash Flow" per share 7.44 7.88 10.34 12.55 15.71 18.26 20.20 21.85 24.80 32.60 Earnings per share 5.70 6.01 8.05 10.07 12.87 15.11 16.88 18.60 21.40 28.50 Dividends Declared per share 1.41 1.88 2.38 2.88 3.45 4.14 4.83 5.45 6.20 7.80 Book Value per share 34.02 35.39 40.10 49.30 53.85 60.78 69.23 78.70 87.40 105.40 Common Shares Outstanding 954,000 953,000 952,000 969,000 960,000 948,000 946,000 940,000 938,000 925,000 Long-Term Debt 16,007 25,460 25,777 28,835 34,581 36,808 38,648 37,000 35,500 29,000 Shareholders' Equity 32,454 33,725 38,177 47,776 51,696 57,616 65,491 74,000 82,000 97,500 Capital Spending per share 1.60 1.63 1.79 2.09 2.15 2.18 2.17 2.30 2.35 2.55 Average Annual P/E Ratio 14.70 19.40 16.80 18.40 19.30 16.60 17.80 16.00 Relative P/E Ratio 0.77 0.98 0.88 0.93 1.04 0.88 0.91 0.90 Average Annual Dividend Yield 1.7% 1.6% 1.8% 1.5% 1.4% 1.7% 1.6% 1.7% Net Operating Revenues 130,474 157,107 184,840 201,159 226,247 242,155 257,141 281,700 304,300 372,500 Operating Margin 9.0% 8.1% 8.5% 9.0% 9.0% 9.6% 10.2% 11.0% 11.5% 14.3% Depreciation, Depletion & Amortization 1,478 1,693 2,055 2,245 2,428 2,720 2,891 3,050 3,200 3,800 Net Profit (SMil) 5,619 5,813 7,792 9,918 12,654 14,593 16,220 17,485 20,075 26,365 Income Tax Rate 41.8% 42.6% 37.9% 30.2% 21.4% 20.0% 23.1% 23.0% 23.0% 24.0% % Net Profit Margin 6.30 6.20 6.60 7.10 Working Capital -7,067 -11,259 -15,373 -13,379 -14,517 -19,148 -18,702 -20,000 -19,000 -16,000 % Return on Total Capital 12.1% 10.4% 13.0% 13.7% 15.5% 16.3% 16.3% 15.8% 17.1% 20.8% % Return on Shareholders' Equity 17.3% 17.2% 20.4% 20.8% 24.5% 25.3% 24.8% 23.5% 24.5% 27.0% % Retained to Common Equity 13.1% 11.9% 14.5% 15.0% 18.1% 18.5% 17.8% 0.0% 0.0% 0.0% All Dividends to Net Profits 24.0% 31.0% 29.0% 28.0% 26.0% 27.0% 28.0% 29.0% 29.0% 27.0% Hide trend 2014 2015 2016 2017 2018 2019 2020 Est. 2021 Est. 2022 Medical Services Net Operating Revenues per share Proj. 2024-2026 402.70 136.77 164.86 194.16 207.59 235.67 255.44 271.82 299.70 324.40 "Cash Flow" per share 7.44 7.88 10.34 12.55 15.71 18.26 20.20 21.85 24.80 32.60 Earnings per share 5.70 6.01 8.05 10.07 12.87 15.11 16.88 18.60 21.40 28.50 Dividends Declared per share 1.41 1.88 2.38 2.88 3.45 4.14 4.83 5.45 6.20 7.80 Book Value per share 34.02 35.39 40.10 49.30 53.85 60.78 69.23 78.70 87.40 105.40 Common Shares Outstanding 954,000 953,000 952,000 969,000 960,000 948,000 946,000 940,000 938,000 925,000 Long-Term Debt 16,007 25,460 25,777 28,835 34,581 36,808 38,648 37,000 35,500 29,000 Shareholders' Equity 32,454 33,725 38,177 47,776 51,696 57,616 65,491 74,000 82,000 97,500 Capital Spending per share 1.60 1.63 1.79 2.09 2.15 2.18 2.17 2.30 2.35 2.55 Average Annual P/E Ratio 14.70 19.40 16.80 18.40 19.30 16.60 17.80 16.00 Relative P/E Ratio 0.77 0.98 0.88 0.93 1.04 0.88 0.91 0.90 Average Annual Dividend Yield 1.7% 1.6% 1.8% 1.5% 1.4% 1.7% 1.6% 1.7% Net Operating Revenues 130,474 157,107 184,840 201,159 226,247 242,155 257,141 281,700 304,300 372,500 Operating Margin 9.0% 8.1% 8.5% 9.0% 9.0% 9.6% 10.2% 11.0% 11.5% 14.3% Depreciation, Depletion & Amortization 1,478 1,693 2,055 2,245 2,428 2,720 2,891 3,050 3,200 3,800 Net Profit (SMil) 5,619 5,813 7,792 9,918 12,654 14,593 16,220 17,485 20,075 26,365 Income Tax Rate 41.8% 42.6% 37.9% 30.2% 21.4% 20.0% 23.1% 23.0% 23.0% 24.0% % Net Profit Margin 6.30 6.20 6.60 7.10 Working Capital -7,067 -11,259 -15,373 -13,379 -14,517 -19,148 -18,702 -20,000 -19,000 -16,000 % Return on Total Capital 12.1% 10.4% 13.0% 13.7% 15.5% 16.3% 16.3% 15.8% 17.1% 20.8% % Return on Shareholders' Equity 17.3% 17.2% 20.4% 20.8% 24.5% 25.3% 24.8% 23.5% 24.5% 27.0% % Retained to Common Equity 13.1% 11.9% 14.5% 15.0% 18.1% 18.5% 17.8% 0.0% 0.0% 0.0% All Dividends to Net Profits 24.0% 31.0% 29.0% 28.0% 26.0% 27.0% 28.0% 29.0% 29.0% 27.0%