

Question
What is the meaning of the slope estimate b = 11.899 as it relates size to assessmentOptions For every increase of 11.899 square feet in
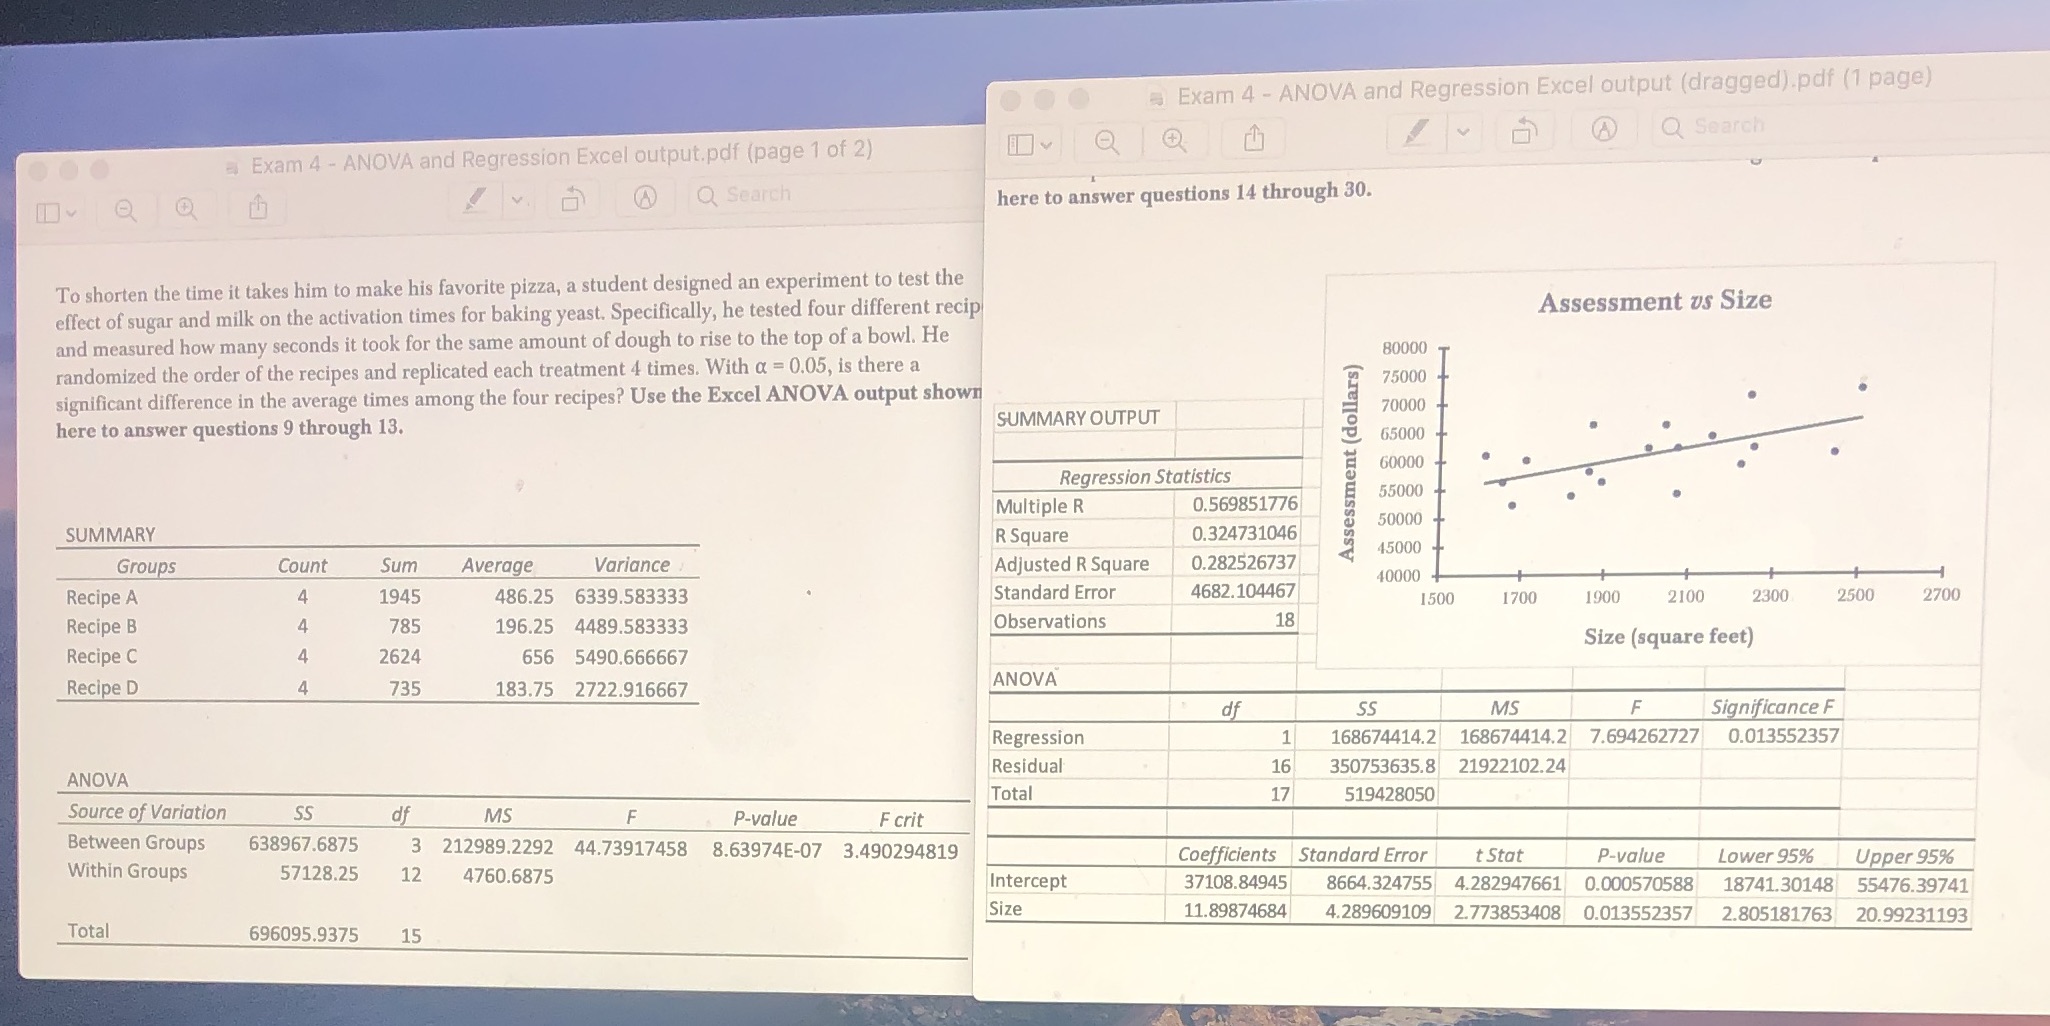
What is the meaning of the slope estimate b = 11.899 as it relates size to assessmentOptions For every increase of 11.899 square feet in size, the assessment increases by $1.For every increase of 1 square foot in size, the assessment decreases by $11.90.For every increase of 11.899 square feet in size, the assessment decreases by $1.For every increase of 1 square foot in size, the assessment increases by $11.90.For every increase of 10 square feet in size, the assessment increases by $11.90.
Step by Step Solution
There are 3 Steps involved in it
Step: 1

Get Instant Access to Expert-Tailored Solutions
See step-by-step solutions with expert insights and AI powered tools for academic success
Step: 2

Step: 3
Ace Your Homework with AI
Get the answers you need in no time with our AI-driven, step-by-step assistance
Get Started
Advanced Engineering Mathematics
Authors: ERWIN KREYSZIG
9th Edition
0471488852, 978-0471488859