What is the missing value in the probability distribution chart shown below X P(X) 200 1 / 1600 100 1 / 1600 50 1 /
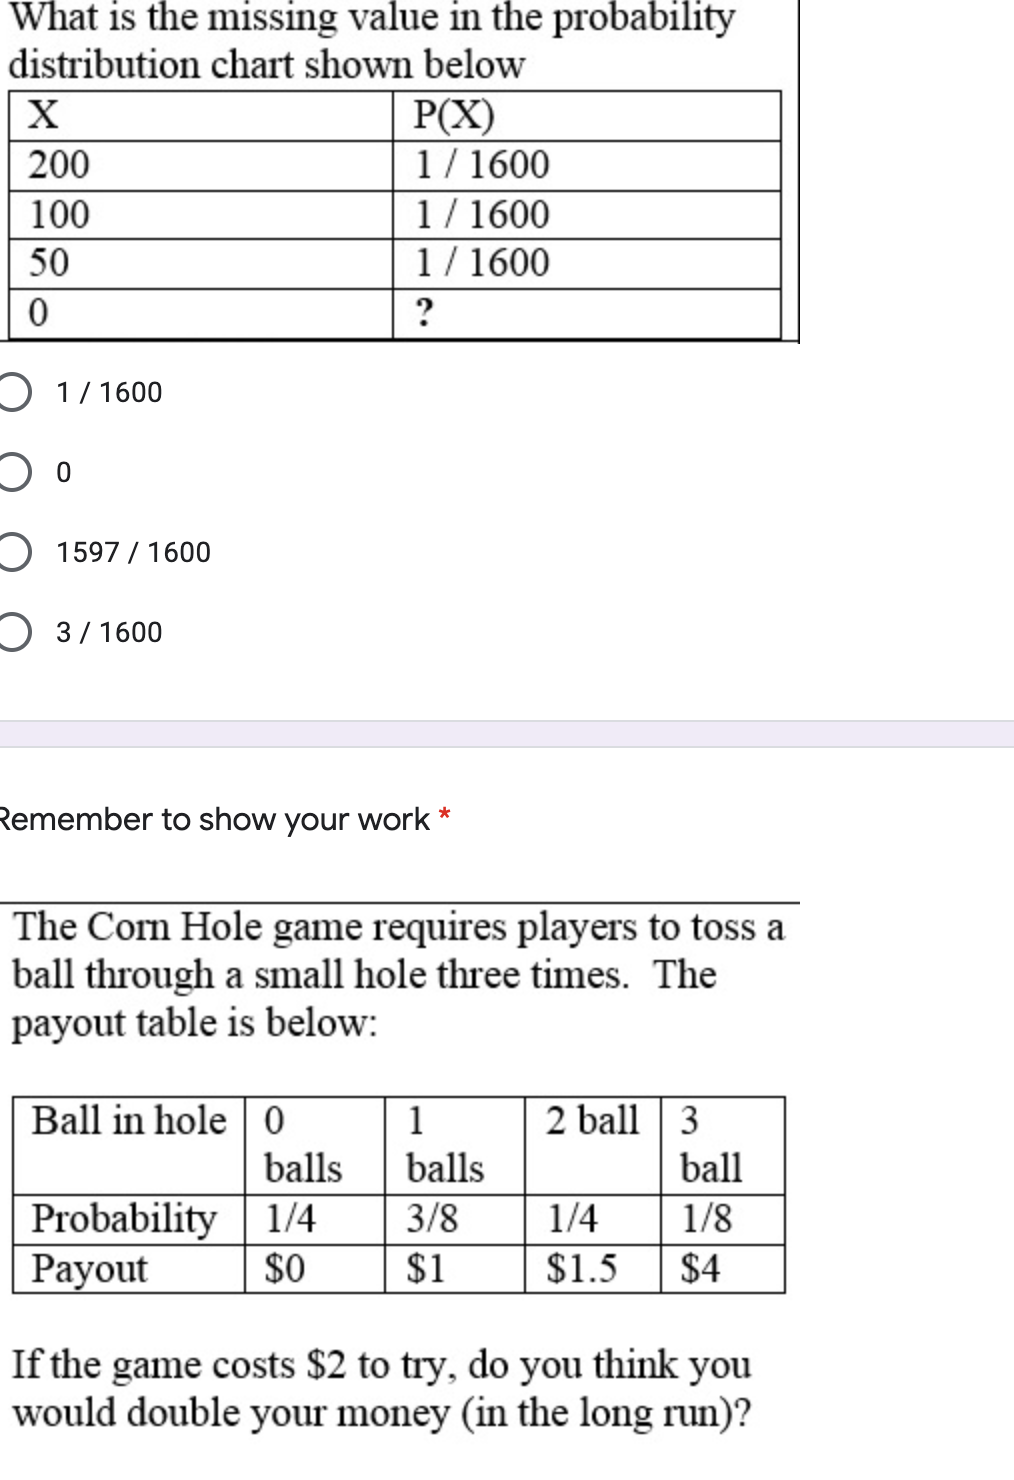
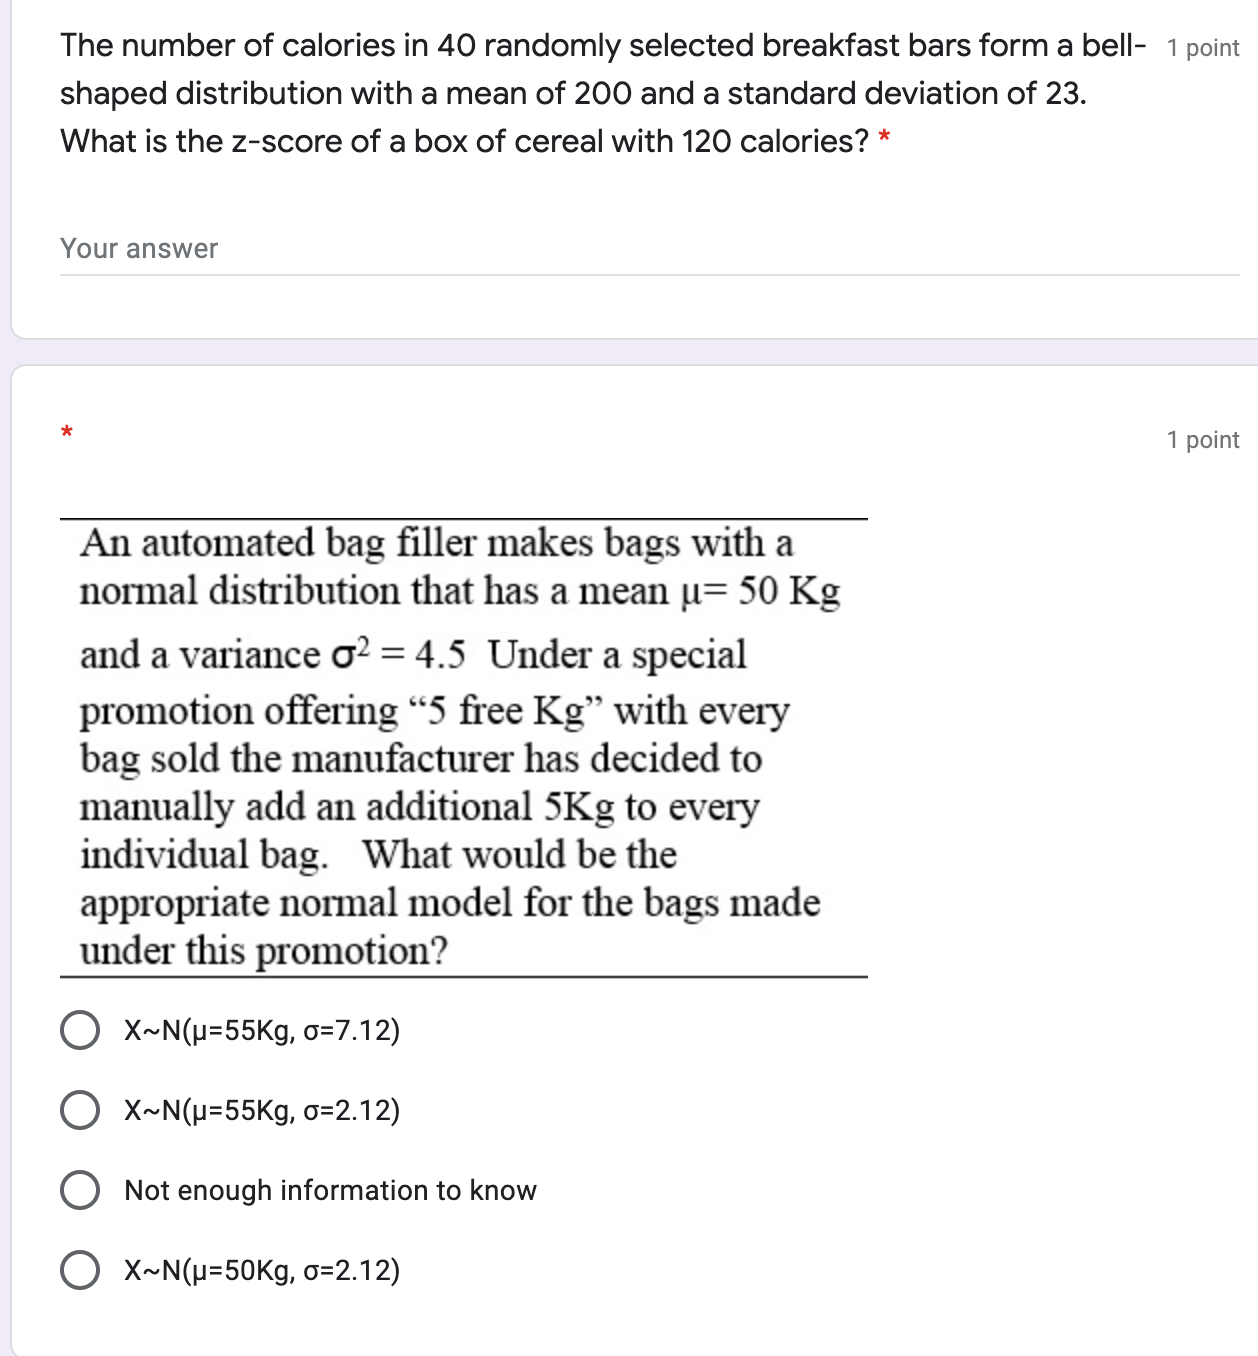
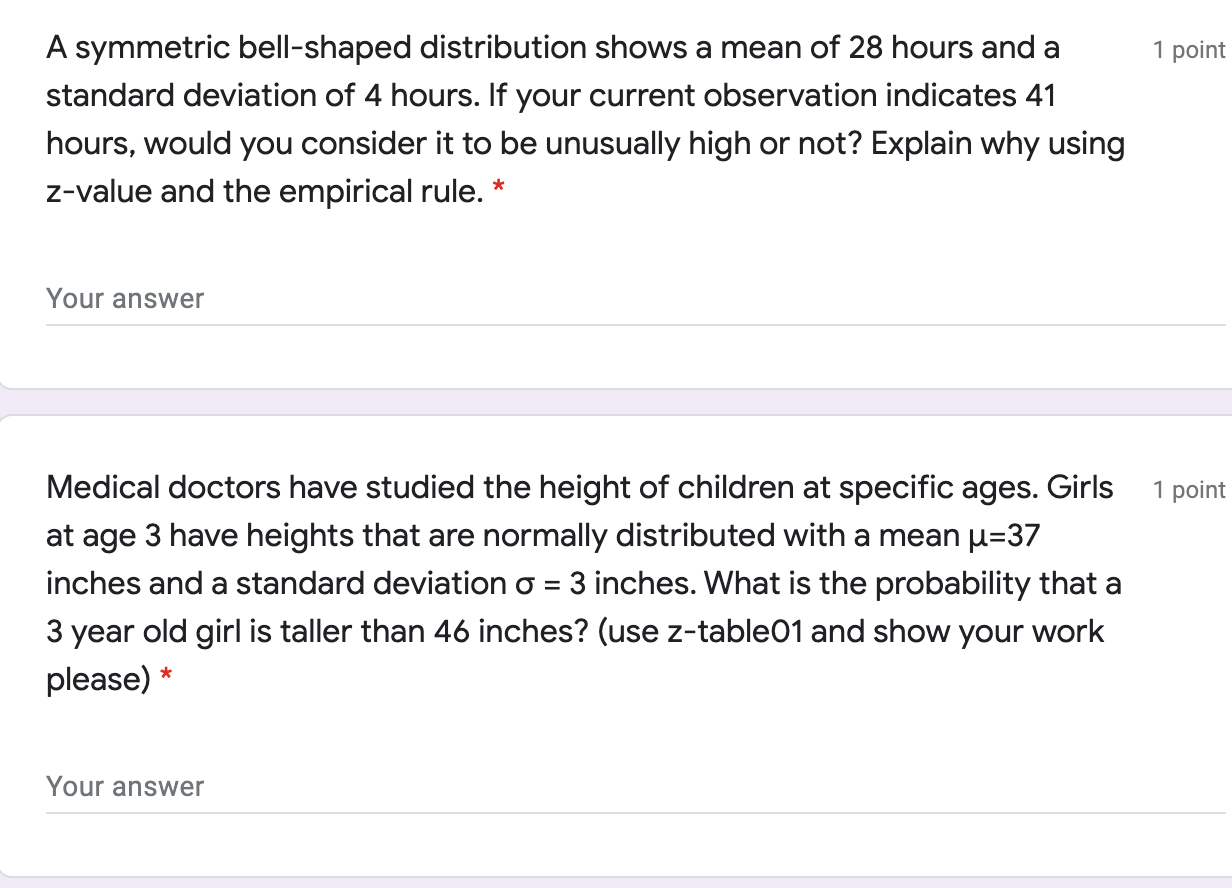
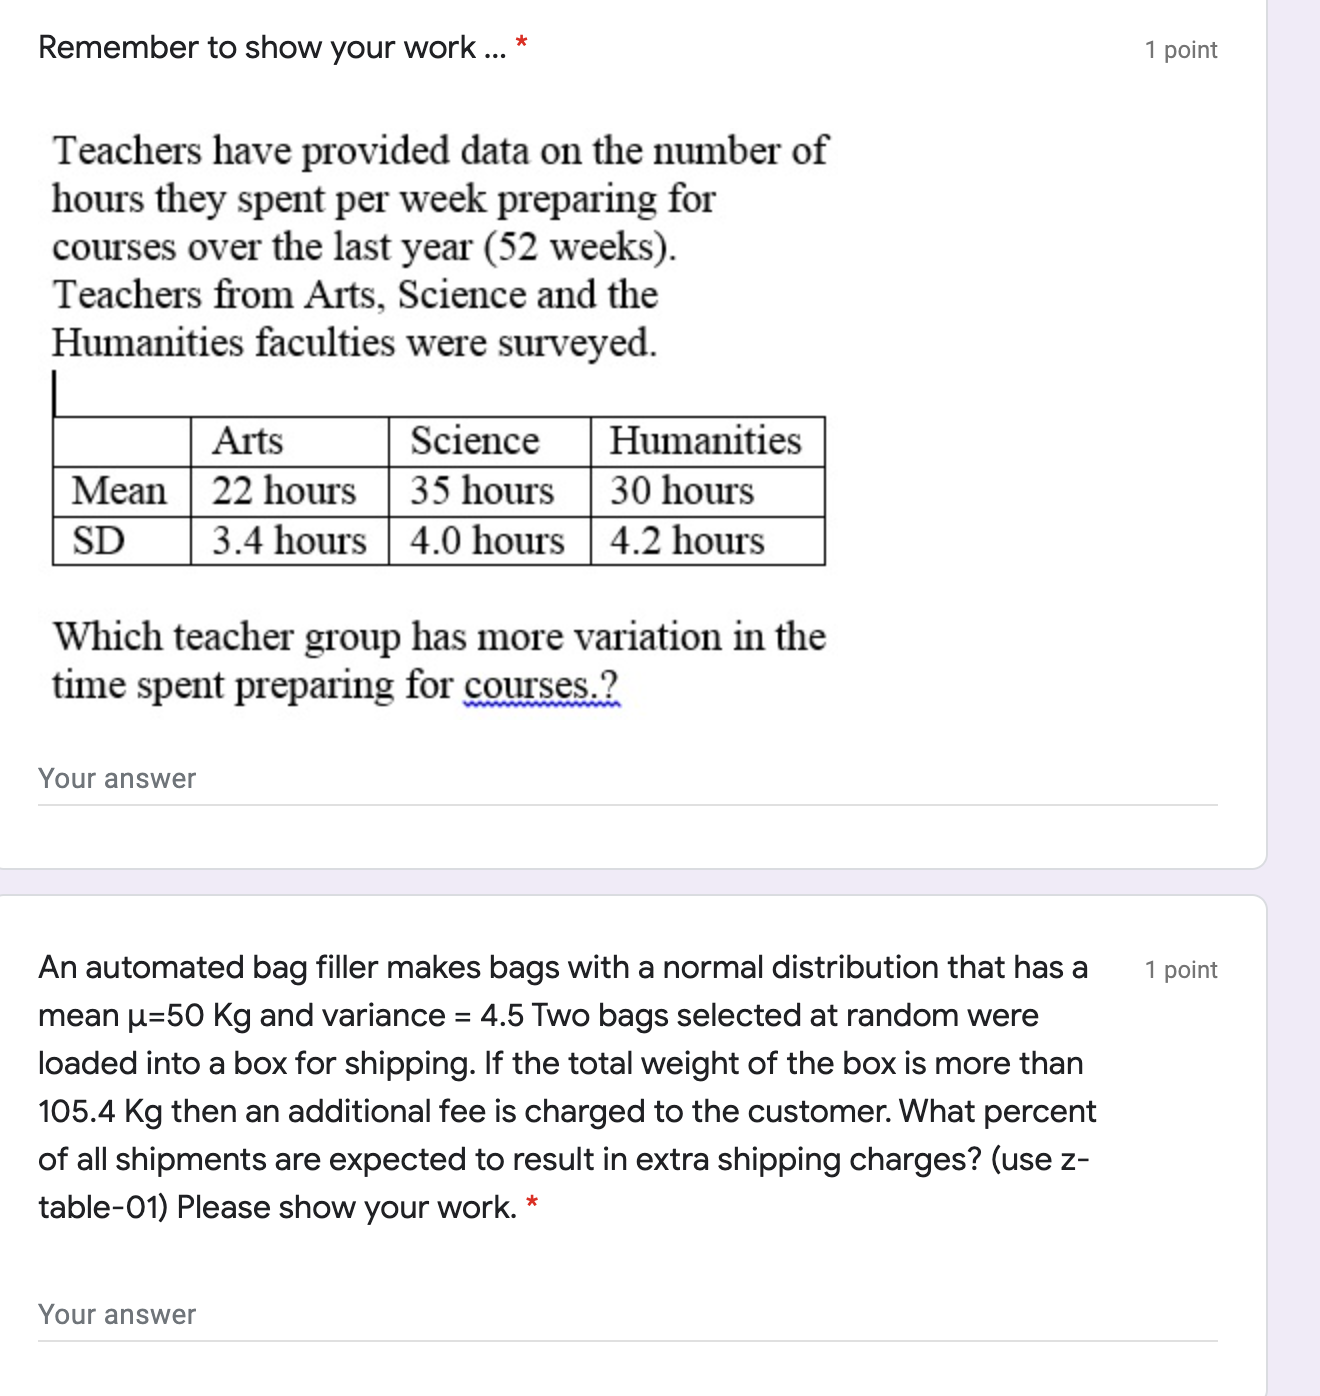
What is the missing value in the probability distribution chart shown below X P(X) 200 1 / 1600 100 1 / 1600 50 1 / 1600 0 ? 1/ 1600 1597 / 1600 3 / 1600 Remember to show your work * The Corn Hole game requires players to toss a ball through a small hole three times. The payout table is below: Ball in hole 0 2 ball 3 balls balls ball Probability 1/4 3/8 1/4 1/8 Payout $0 $1 $1.5 $4 If the game costs $2 to try, do you think you would double your money (in the long run)?The number of calories in 40 randomly selected breakfast bars form a bell 1 point shaped distribution with a mean of 200 and a standard deviation of 23. What is the z-score of a box of cereal with 120 calories? * Your answer 1 point An automated bag ller makes bags with a normal distribution that has a mean u: 50 Kg and a variance 02 = 4.5 Under a special promotion offering \"5 free Kg\" with every bag sold the manufacturer has decided to manually add an additional 5Kg to every individual bag. What would be the appropriate normal model for the bags made under this promotion? 0 X~N(u=55Kg,o=7.12) O X~N(u=55Kg,o=2.12) 0 Not enough information to know 0 X~N(u=50Kg, o=2.12) A symmetric bellshaped distribution shows a mean of 28 hours and a \"I point standard deviation of 4 hours. If your current observation indicates 41 hours, would you consider it to be unusually high or not? Explain why using z-value and the empirical rule. * Your answer Medical doctors have studied the height of children at specific ages. Girls 1 point at age 3 have heights that are normally distributed with a mean u=37 inches and a standard deviation 0 = 3 inches. What is the probability that a 3 year old girl is taller than 46 inches? (use z-table01 and show your work please) * Your answer Remember to show your work * Teachers have provided data on the number of hours they spent per week preparing for courses over the last year (52 weeks). Teachers 'om Arts, Science and the Humanities faculties were surveyed. -m IKE!!!\" E}-__ Which teacher group has more variation in the time spent preparing for courses? Your answer An automated bag filler makes bags with a normal distribution that has a mean u=50 Kg and variance = 4.5 Two bags selected at random were loaded into a box for shipping. If the total weight of the box is more than 105.4 Kg then an additional fee is charged to the customer. What percent of all shipments are expected to result in extra shipping charges? (use : table-O1) Please show your work. * Your answer 'I point 'I point
Step by Step Solution
There are 3 Steps involved in it
Step: 1
Get Instant Access to Expert-Tailored Solutions
See step-by-step solutions with expert insights and AI powered tools for academic success
Step: 2
Step: 3
Ace Your Homework with AI
Get the answers you need in no time with our AI-driven, step-by-step assistance