Answered step by step
Verified Expert Solution
Question
1 Approved Answer
What is the real expected return using the CAPM? SHOW ALL EXCEL FUNCTIONS FOR THUMBS UP. 1997 1998 1999 2000 2001 2002 2003 2004 2005

What is the real expected return using the CAPM?
SHOW ALL EXCEL FUNCTIONS FOR THUMBS UP.
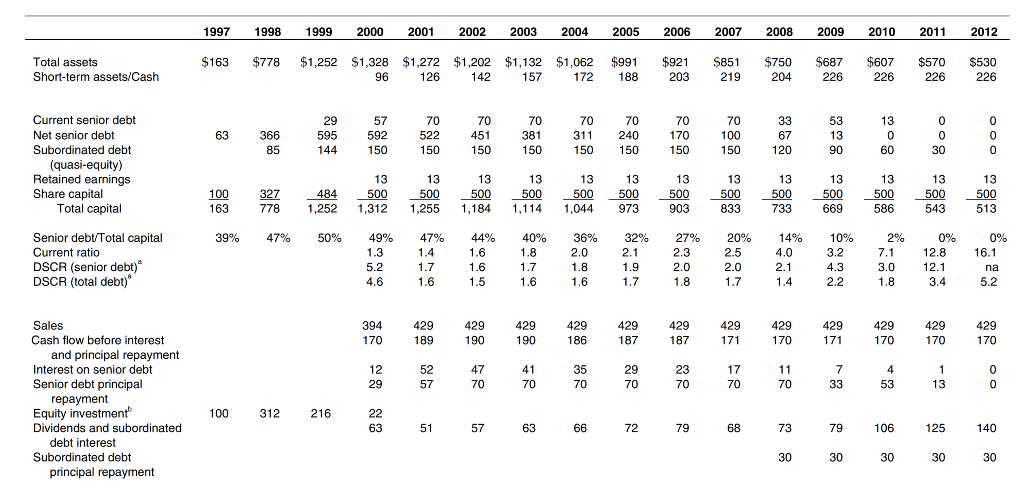
1997 1998 1999 2000 2001 2002 2003 2004 2005 2006 2007 2008 2009 2010 2011 2012 $163 $778 $1,252 Total assets Short-term assets/Cash $1,328 $1,272 $1,202 $1,132 $1,062 $991 126 142 157 172 188 $921 203 $851 219 $750 204 $687 226 $607 226 $570 226 $530 226 63 366 85 29 595 144 70 522 150 70 451 150 70 381 150 70 311 150 70 240 150 gid 70 170 150 70 100 150 53 13 90 13 0 60 0 30 120 Current senior debt Net senior debt Subordinated debt (quasi-equity) Retained earnings Share capital Total capital 100 163 13 500 1.255 13 500 327 778 13 500 1,184 484 1,252 13 500 1,114 13 500 973 13 500 903 13 500 833 500 13 500 669 OBS: go? 13 500 586 500 733 13 500 543 1,044 1,312 39% 47% 50% 49% Senior debt Total capital Current ratio DSCR (senior debt) DSCR (total debt) 47% 1.4 1.7 44% 1.6 1.6 1.5 40% 1.8 1.7 1.6 36% 2.0 1.8 1.6 32% 2.1 1.9 1.7 27% 2.3 2.0 1.8 20% 2.5 2.0 1.7 14% 4.0 2.1 1.4 10% 3.2 4.3 2.2 2% 7.1 3.0 1.8 0. . . 18 ... 0% 12.8 12.1 3.4 1.6 88 the govern de todo 429 429 189 429 190 429 186 429 187 429 187 429 171 429 170 429 171 429 170 429 170 190 52 57 47 70 41 70 35 70 29 70 23 70 17 70 11 70 7 33 4 53 Sales Cash flow before interest and principal repayment Interest on senior debt Senior debt principal repayment Equity investment Dividends and subordinated debt interest Subordinated debt principal repayment 1 13 100 312 216 51 57 63 66 72 79 68 73 79 106 125 140 30 30 30 30 30 1997 1998 1999 2000 2001 2002 2003 2004 2005 2006 2007 2008 2009 2010 2011 2012 $163 $778 $1,252 Total assets Short-term assets/Cash $1,328 $1,272 $1,202 $1,132 $1,062 $991 126 142 157 172 188 $921 203 $851 219 $750 204 $687 226 $607 226 $570 226 $530 226 63 366 85 29 595 144 70 522 150 70 451 150 70 381 150 70 311 150 70 240 150 gid 70 170 150 70 100 150 53 13 90 13 0 60 0 30 120 Current senior debt Net senior debt Subordinated debt (quasi-equity) Retained earnings Share capital Total capital 100 163 13 500 1.255 13 500 327 778 13 500 1,184 484 1,252 13 500 1,114 13 500 973 13 500 903 13 500 833 500 13 500 669 OBS: go? 13 500 586 500 733 13 500 543 1,044 1,312 39% 47% 50% 49% Senior debt Total capital Current ratio DSCR (senior debt) DSCR (total debt) 47% 1.4 1.7 44% 1.6 1.6 1.5 40% 1.8 1.7 1.6 36% 2.0 1.8 1.6 32% 2.1 1.9 1.7 27% 2.3 2.0 1.8 20% 2.5 2.0 1.7 14% 4.0 2.1 1.4 10% 3.2 4.3 2.2 2% 7.1 3.0 1.8 0. . . 18 ... 0% 12.8 12.1 3.4 1.6 88 the govern de todo 429 429 189 429 190 429 186 429 187 429 187 429 171 429 170 429 171 429 170 429 170 190 52 57 47 70 41 70 35 70 29 70 23 70 17 70 11 70 7 33 4 53 Sales Cash flow before interest and principal repayment Interest on senior debt Senior debt principal repayment Equity investment Dividends and subordinated debt interest Subordinated debt principal repayment 1 13 100 312 216 51 57 63 66 72 79 68 73 79 106 125 140 30 30 30 30 30Step by Step Solution
There are 3 Steps involved in it
Step: 1

Get Instant Access to Expert-Tailored Solutions
See step-by-step solutions with expert insights and AI powered tools for academic success
Step: 2

Step: 3

Ace Your Homework with AI
Get the answers you need in no time with our AI-driven, step-by-step assistance
Get Started


