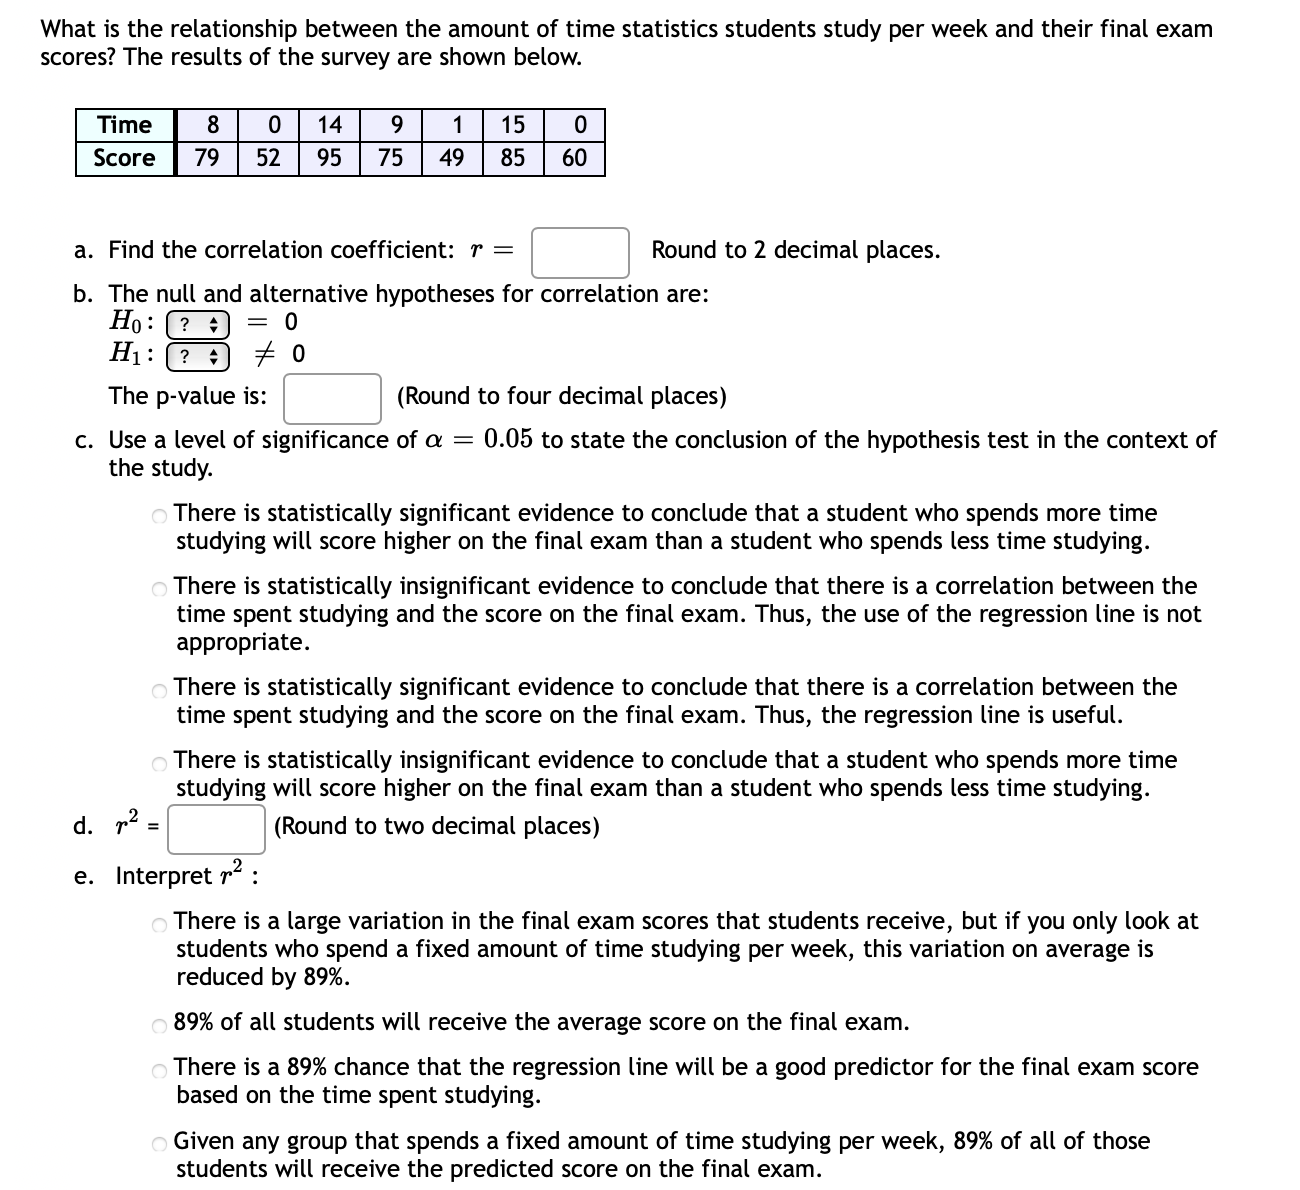
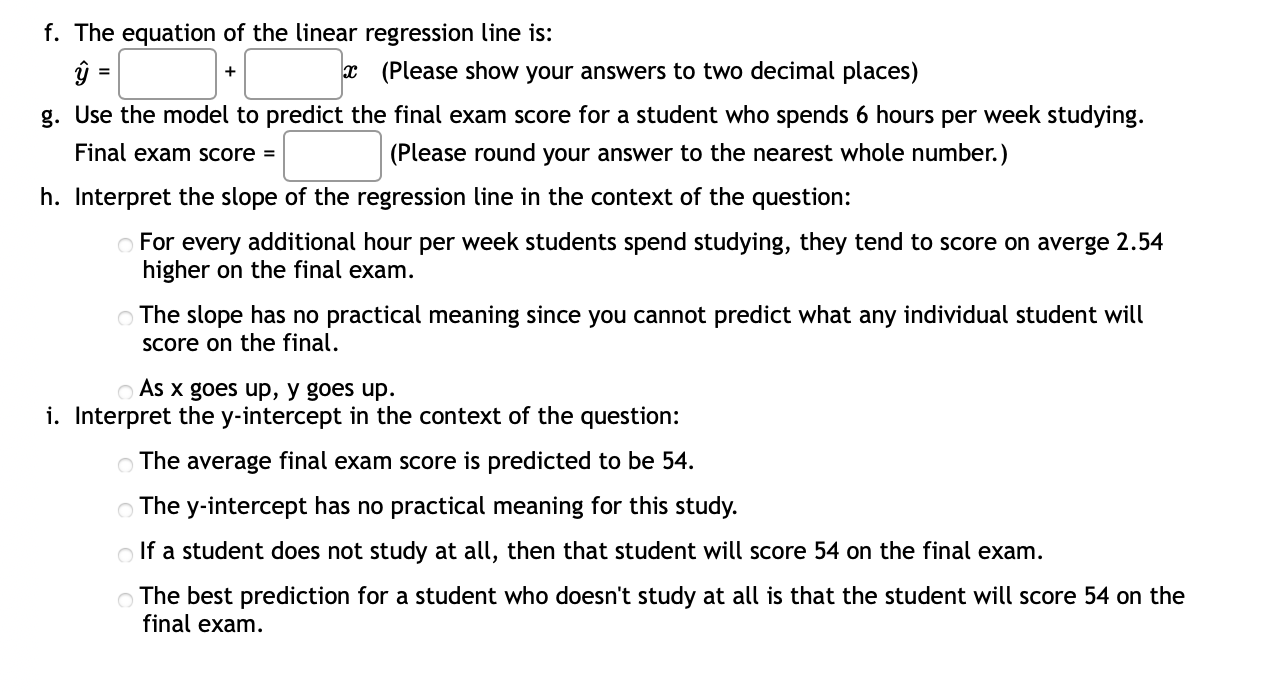
What is the relationship between the amount of time statistics students study per week and their final exam scores? The results of the survey are shown below. \"HEEIIIEIEI \"mum a. Find the correlation coefficient: 'r = C] Round to 2 decimal places. b. The null and alternative hypotheses for correlation are: Ho=-=o H-760 The p-value is: C] (Round to four decimal places) c. Use a level of significance of a = 0.05 to state the conclusion of the hypothesis test in the context of the study. There is statistically significant evidence to conclude that a student who spends more time studying will score higher on the final exam than a student who spends less time studying. There is statistically insignificant evidence to conclude that there is a correlation between the time spent studying and the score on the final exam. Thus, the use of the regression line is not appropriate. There is statistically significant evidence to conclude that there is a correlation between the time spent studying and the score on the final exam. Thus, the regression line is useful. There is statistically insignificant evidence to conclude that a student who spends more time studying will score higher on the final exam than a student who spends less time studying. d. r2 = C] (Round to two decimal places) e. Interpret r2 : There is a large variation in the final exam scores that students receive, but if you only look at students who spend a fixed amount of time studying per week, this variation on average is reduced by 89%. 89% of all students will receive the average score on the final exam. There is a 89% chance that the regression line will be a good predictor for the final exam score based on the time spent studying. Given any group that spends a fixed amount of time studying per week, 89% of all of those students will receive the predicted score on the final exam. f. The equation of the linear regression line is: g = C] + Sm {Please show your answers to two decimal places) g. Use the model to predict the final exam score for a student who spends 6 hours per week studying. Final exam score = C] (Please round your answer to the nearest whole number.) h. Interpret the slope of the regression line in the context of the question: For every additional hour per week students spend studying, they tend to score on averge 2.54 higher on the final exam. The slope has no practical meaning since you cannot predict what any individual student will score on the final. As x goes up, y goes up. i. Interpret the y-intercept in the context of the question: The average final exam score is predicted to be 54. The y-intercept has no practical meaning for this study. If a student does not study at all, then that student will score 54 on the final exam. The best prediction for a student who doesn't study at all is that the student will score 54 on the final exam