What is your assessment of The Walt Disney Companys financial and operating performance in fiscal years 2015-2019? What is your assessment of the relative contribution of each business unit to the financial strength of Disney based on the 2018 and 2019 fiscal year financial data?
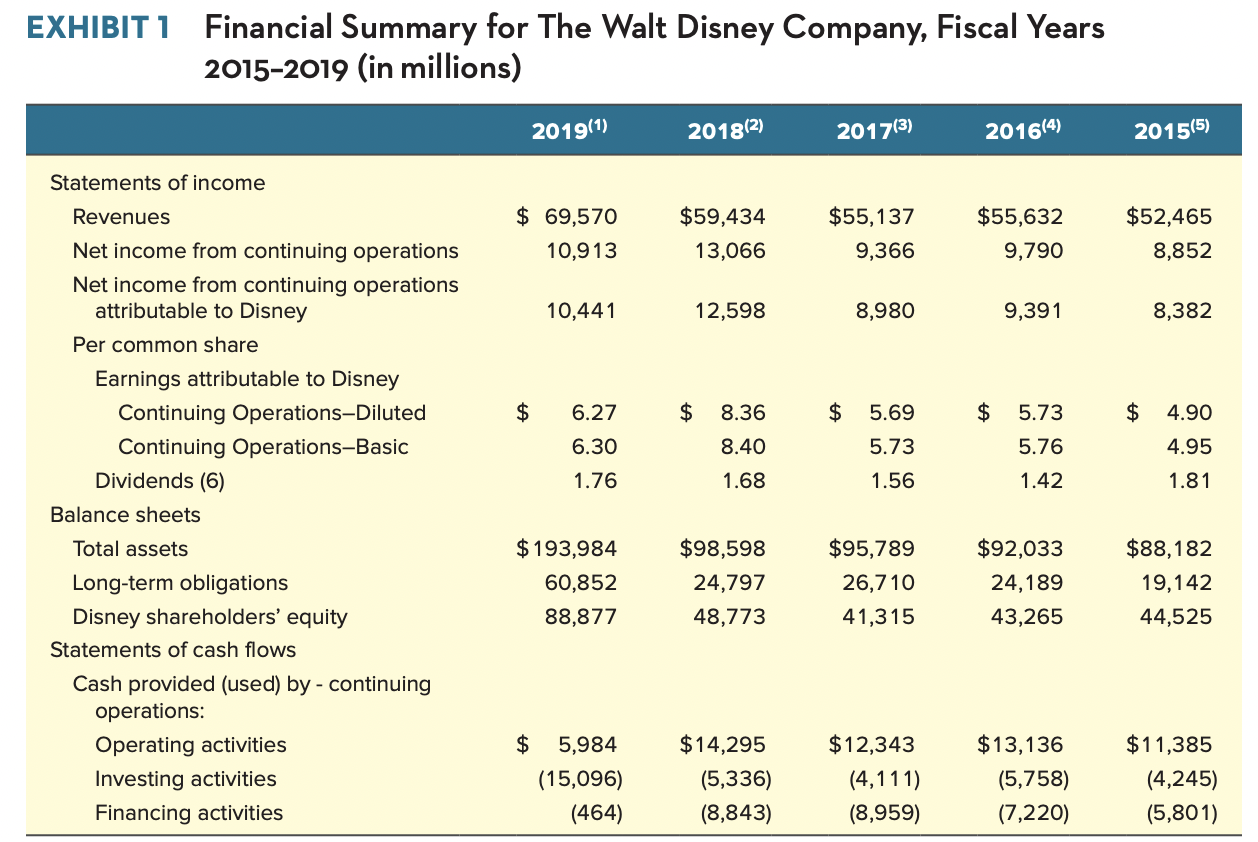
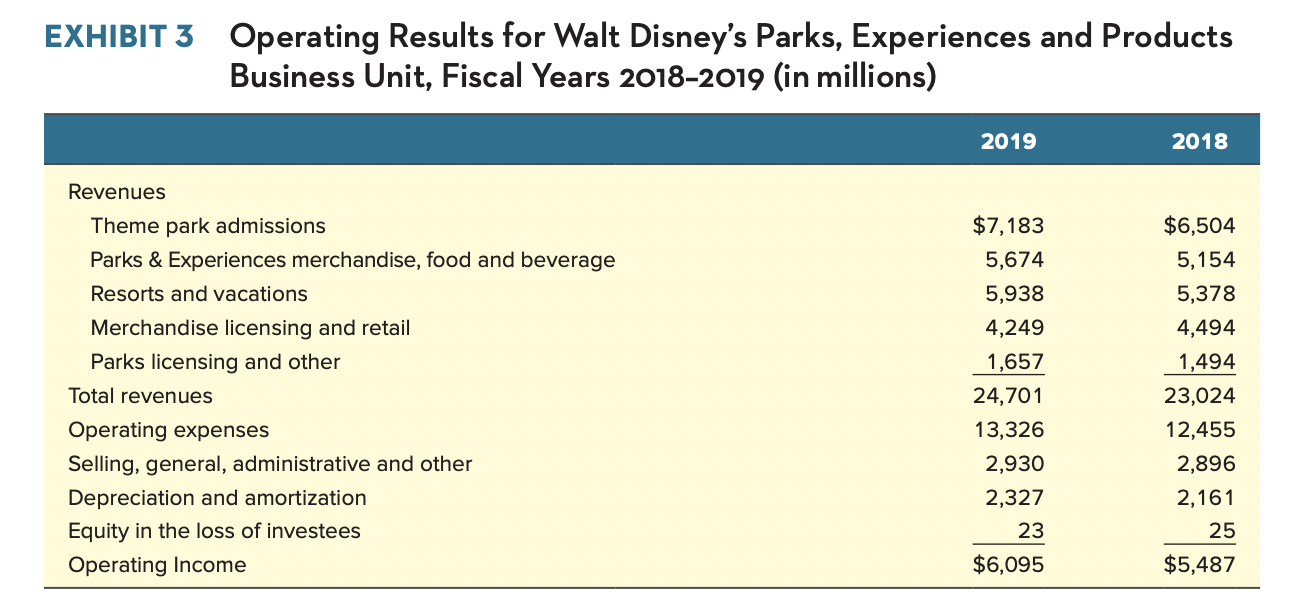
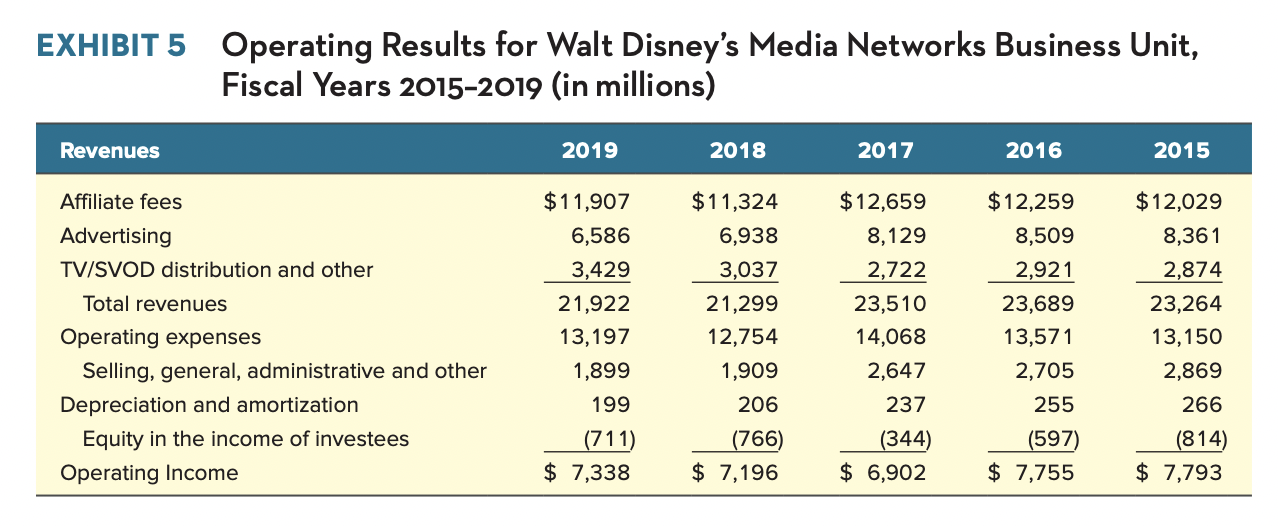
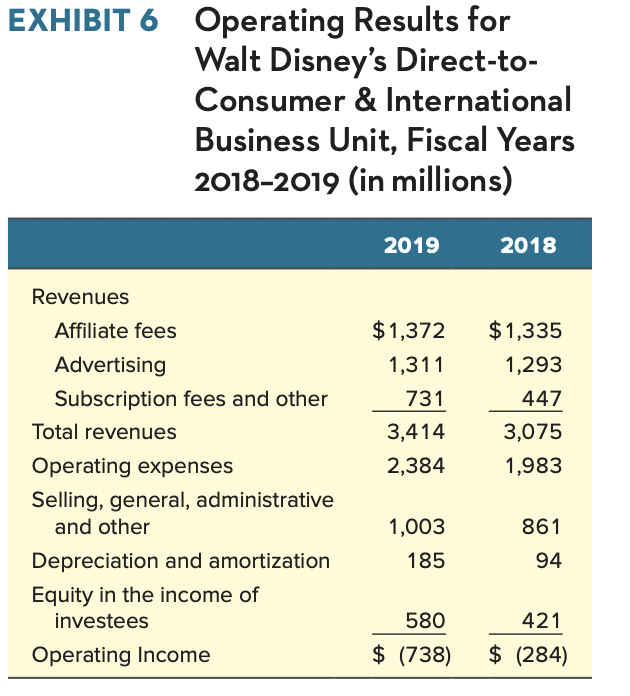
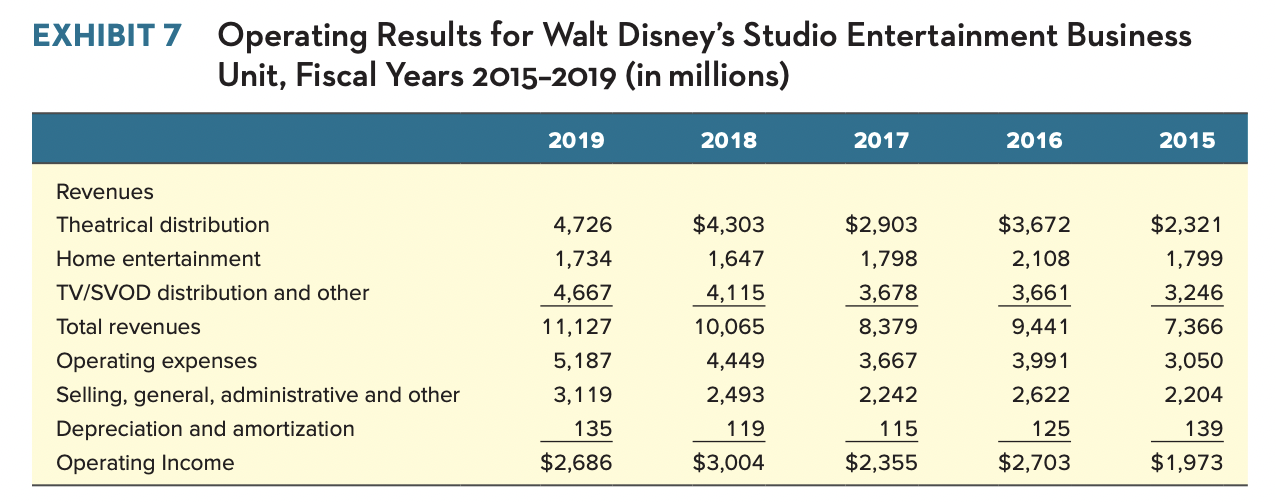
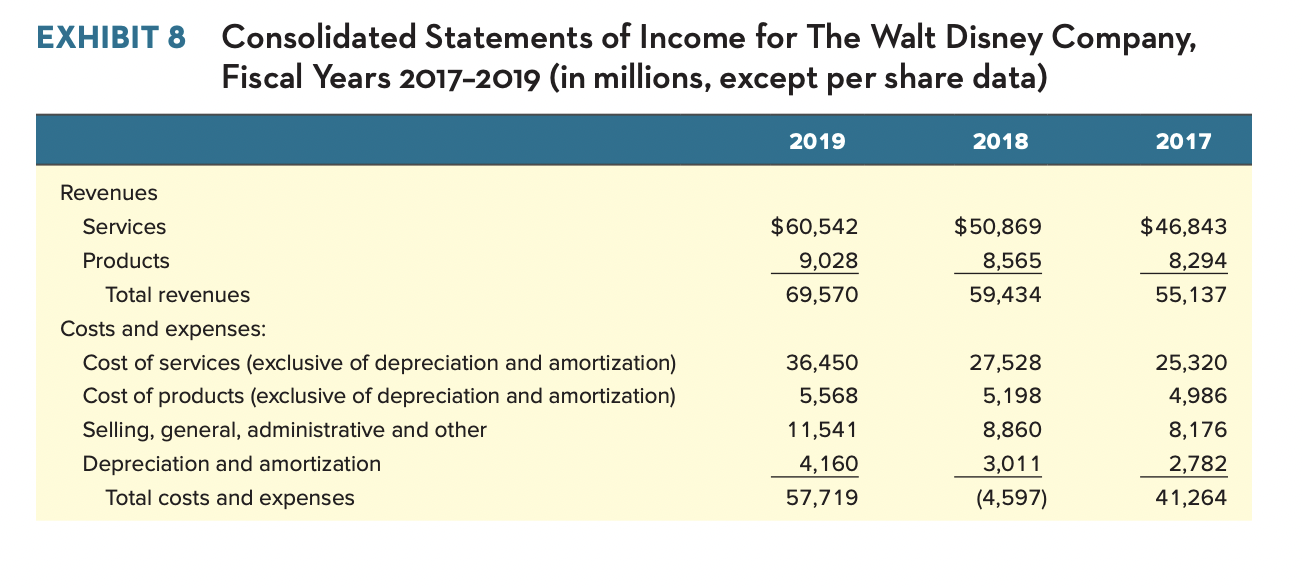
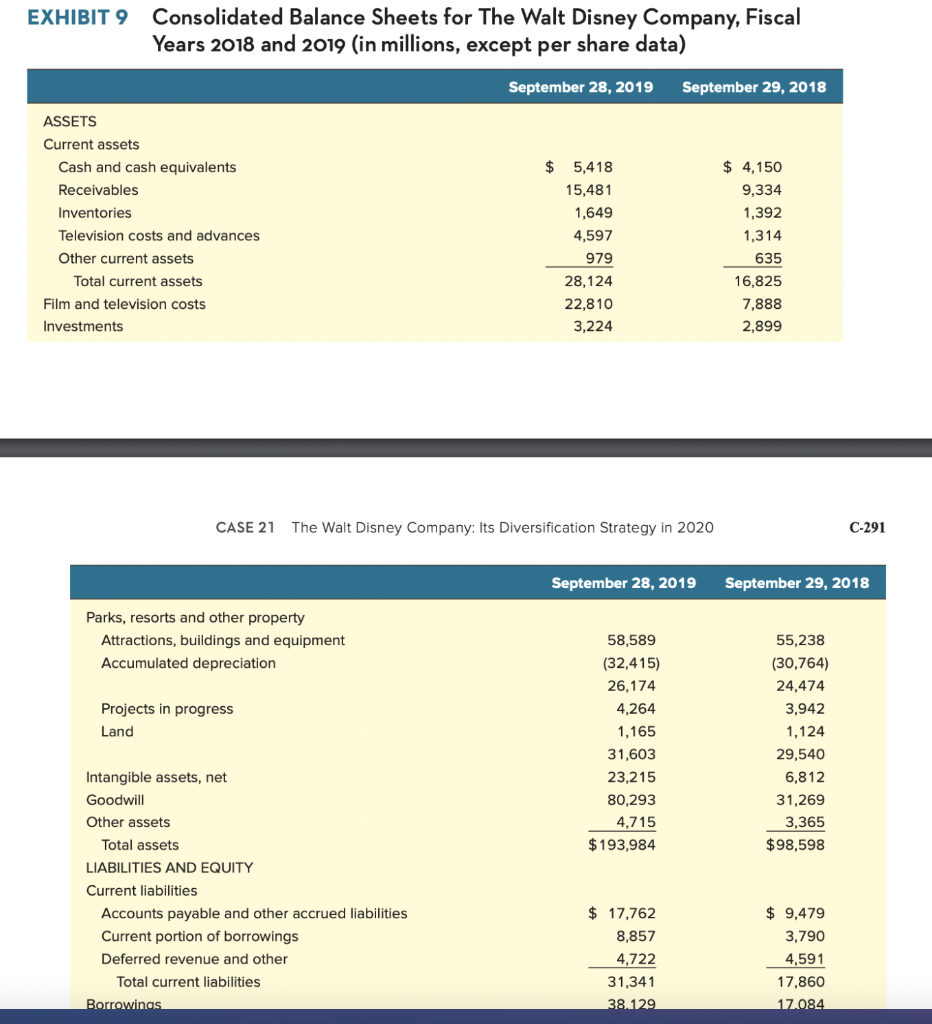
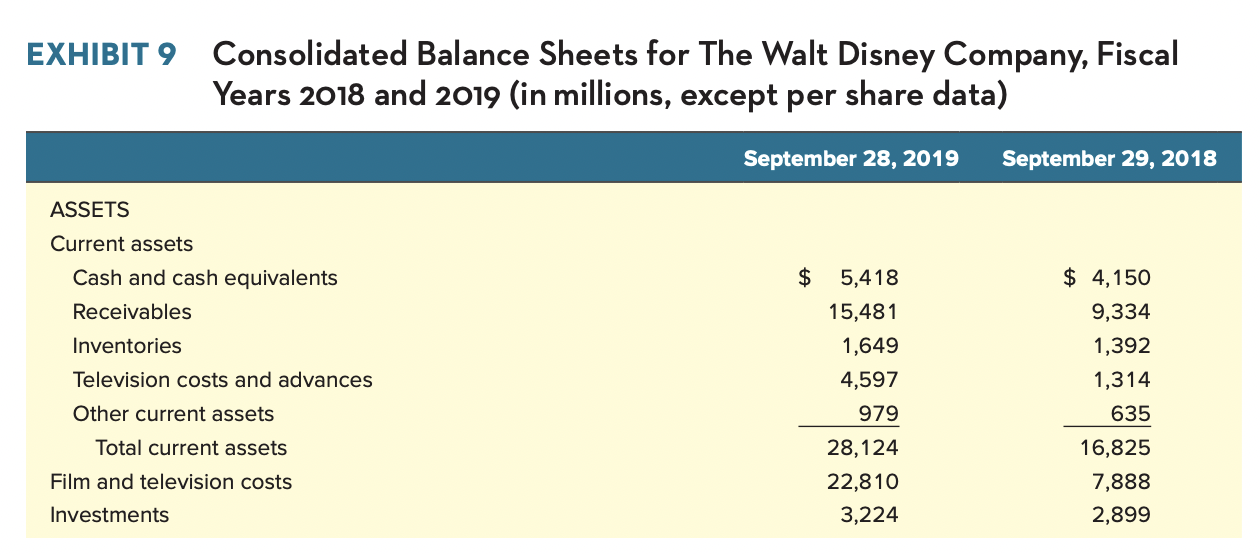
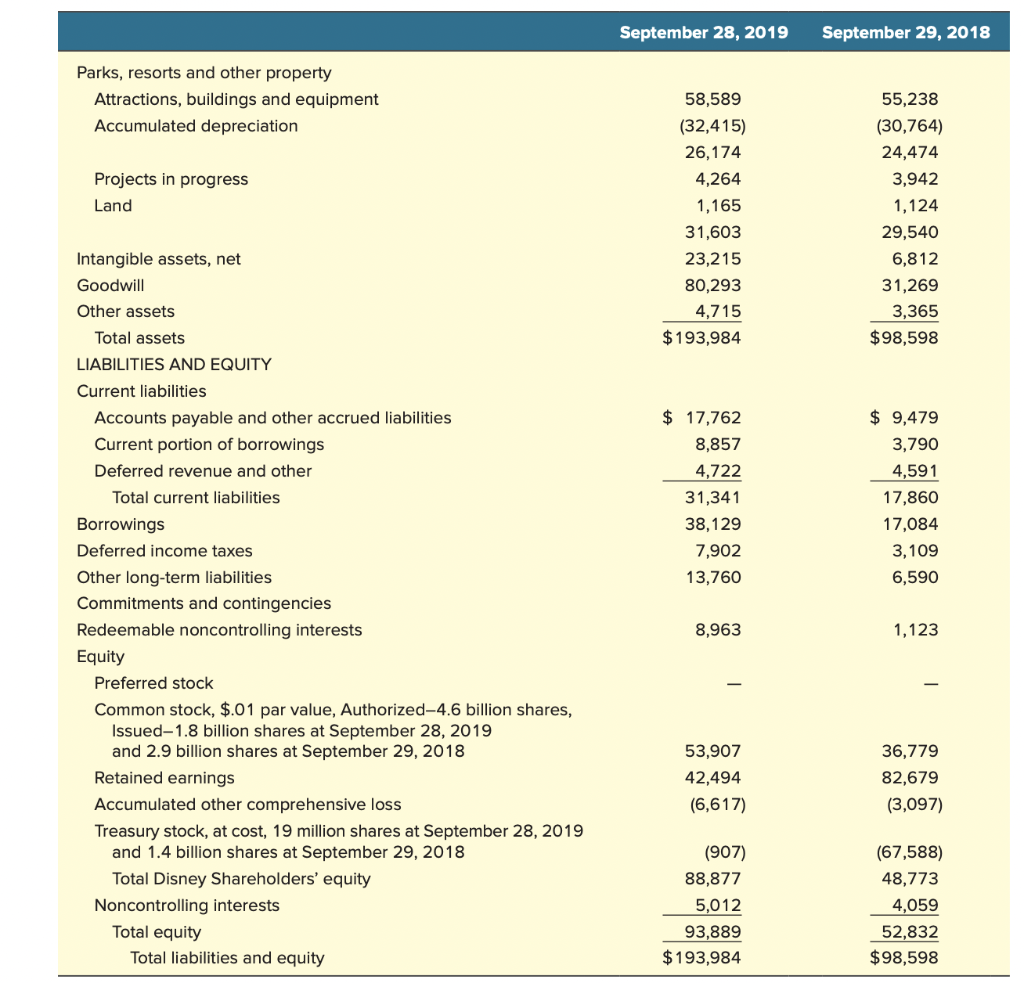
EXHIBIT I Financial Summary for The Walt Disney Company, Fiscal Years 2015-2019 (in millions) 2019(1) 2018(2) 2017(3) 2016(4) 2015(5) $ 69,570 10,913 $59,434 13,066 $55,137 9,366 $55,632 9,790 $52,465 8,852 10,441 12,598 8,980 9,391 8,382 $ $ 8.36 $ 5.69 $ $ 4.90 6.27 6.30 5.73 5.76 8.40 5.73 1.56 4.95 1.81 1.76 1.68 1.42 Statements of income Revenues Net income from continuing operations Net income from continuing operations attributable to Disney Per common share Earnings attributable to Disney Continuing Operations-Diluted Continuing Operations-Basic Dividends (6) Balance sheets Total assets Long-term obligations Disney shareholders' equity Statements of cash flows Cash provided (used) by - continuing operations: Operating activities Investing activities Financing activities $193,984 60,852 88,877 $98,598 24,797 48,773 $95,789 26,710 41,315 $92,033 24,189 43,265 $88,182 19,142 44,525 $ 5,984 (15,096) (464) $14,295 (5,336) (8,843) $12,343 (4,111) (8,959) $13,136 (5,758) (7,220) $11,385 (4,245) (5,801) EXHIBIT 3 Operating Results for Walt Disney's Parks, Experiences and Products Business Unit, Fiscal Years 2018-2019 (in millions) 2019 2018 Revenues Theme park admissions Parks & Experiences merchandise, food and beverage Resorts and vacations Merchandise licensing and retail Parks licensing and other Total revenues Operating expenses Selling, general, administrative and other Depreciation and amortization Equity in the loss of investees Operating Income $7,183 5,674 5,938 4,249 1,657 24,701 13,326 2,930 2,327 23 $6,095 $6,504 5,154 5,378 4,494 1,494 23,024 12,455 2,896 2,161 25 $5,487 EXHIBIT 5 Operating Results for Walt Disney's Media Networks Business Unit, Fiscal Years 2015-2019 (in millions) Revenues 2019 2018 2017 2016 2015 Affiliate fees Advertising TV/SVOD distribution and other Total revenues Operating expenses Selling, general, administrative and other Depreciation and amortization Equity in the income of investees Operating Income $11,907 6,586 3,429 21,922 13,197 1,899 $11,324 6,938 3,037 21,299 12,754 1,909 206 (766) $ 7,196 $12,659 8,129 2,722 23,510 14,068 2,647 237 (344) $ 6,902 $12,259 8,509 2,921 23,689 13,571 2,705 255 (597) $ 7,755 $12,029 8,361 2,874 23,264 13,150 2,869 266 (814) $ 7,793 199 (711) $ 7,338 EXHIBIT 6 Operating Results for Walt Disney's Direct-to- Consumer & International Business Unit, Fiscal Years 2018-2019 (in millions) 2019 2018 Revenues Affiliate fees Advertising Subscription fees and other Total revenues Operating expenses Selling, general, administrative and other Depreciation and amortization Equity in the income of investees Operating Income $1,372 1,311 731 3,414 2,384 $1,335 1,293 447 3,075 1,983 861 1,003 185 94 580 421 $ (284) $ (738) EXHIBIT 7 Operating Results for Walt Disney's Studio Entertainment Business Unit, Fiscal Years 2015-2019 (in millions) 2019 2018 2017 2016 2015 Revenues Theatrical distribution Home entertainment TV/SVOD distribution and other 4,726 1,734 4,667 11,127 5,187 3,119 135 $2,686 Total revenues $4,303 1,647 4,115 10,065 4,449 2,493 119 $3,004 $2,903 1,798 3,678 8,379 3,667 2,242 115 $3,672 2,108 3,661 9,441 3,991 2,622 $2,321 1,799 3,246 7,366 3,050 2,204 139 $1,973 Operating expenses Selling, general, administrative and other Depreciation and amortization Operating Income 125 $2,355 $2,703 EXHIBIT 8 Consolidated Statements of Income for The Walt Disney Company, Fiscal Years 2017-2019 (in millions, except per share data) 2019 2018 2017 Revenues Services Products $60,542 9,028 69,570 $50,869 8,565 59,434 $46,843 8,294 55,137 Total revenues Costs and expenses: Cost of services (exclusive of depreciation and amortization) Cost of products (exclusive of depreciation and amortization) Selling, general, administrative and other Depreciation and amortization Total costs and expenses 36,450 5,568 11,541 4,160 57,719 27,528 5,198 8,860 3,011 (4,597) 25,320 4,986 8,176 2,782 41,264 EXHIBIT 9 Consolidated Balance Sheets for The Walt Disney Company, Fiscal Years 2018 and 2019 (in millions, except per share data) September 28, 2019 September 29, 2018 ASSETS Current assets Cash and cash equivalents Receivables Inventories Television costs and advances Other current assets Total current assets Film and television costs Investments $ 5,418 15,481 1,649 4,597 979 28,124 22,810 3,224 $ 4,150 9,334 1,392 1,314 635 16,825 7,888 2,899 CASE 21 The Walt Disney Company: Its Diversification Strategy in 2020 C-291 September 28, 2019 September 29, 2018 Parks, resorts and other property Attractions, buildings and equipment Accumulated depreciation Projects in progress Land 58,589 (32,415) 26,174 4,264 1,165 31,603 23,215 80,293 4,715 $ 193,984 55,238 (30,764) 24,474 3,942 1,124 29,540 6,812 31,269 3,365 $98,598 Intangible assets, net Goodwill Other assets Total assets LIABILITIES AND EQUITY Current liabilities Accounts payable and other accrued liabilities Current portion of borrowings Deferred revenue and other Total current liabilities Borrowings $ 17,762 8,857 4,722 31,341 38,129 $ 9,479 3,790 4,591 17,860 17.084 EXHIBIT 9 Consolidated Balance Sheets for The Walt Disney Company, Fiscal Years 2018 and 2019 (in millions, except per share data) September 28, 2019 September 29, 2018 ASSETS Current assets Cash and cash equivalents Receivables Inventories $ Television costs and advances 5,418 15,481 1,649 4,597 979 28,124 22,810 3,224 $ 4,150 9,334 1,392 1,314 635 16,825 7,888 2,899 Other current assets Total current assets Film and television costs Investments September 28, 2019 September 29, 2018 Parks, resorts and other property Attractions, buildings and equipment Accumulated depreciation Projects in progress Land 58,589 (32,415) 26,174 4,264 1,165 31,603 23,215 80,293 4,715 $193,984 55,238 (30,764) 24,474 3,942 1,124 29,540 6,812 31,269 3,365 $98,598 $ 17,762 8,857 4,722 31,341 38,129 7,902 13,760 $ 9,479 3,790 4,591 17,860 17,084 3,109 6,590 Intangible assets, net Goodwill Other assets Total assets LIABILITIES AND EQUITY Current liabilities Accounts payable and other accrued liabilities Current portion of borrowings Deferred revenue and other Total current liabilities Borrowings Deferred income taxes Other long-term liabilities Commitments and contingencies Redeemable noncontrolling interests Equity Preferred stock Common stock, $.01 par value, Authorized-4.6 billion shares, Issued-1.8 billion shares at September 28, 2019 and 2.9 billion shares at September 29, 2018 Retained earnings Accumulated other comprehensive loss Treasury stock, at cost, 19 million shares at September 28, 2019 and 1.4 billion shares at September 29, 2018 Total Disney Shareholders' equity Noncontrolling interests Total equity Total liabilities and equity 8,963 1,123 53,907 42,494 (6,617) 36,779 82,679 (3,097) (907) 88,877 5,012 93,889 $193,984 (67,588) 48,773 4,059 52,832 $98,598 EXHIBIT I Financial Summary for The Walt Disney Company, Fiscal Years 2015-2019 (in millions) 2019(1) 2018(2) 2017(3) 2016(4) 2015(5) $ 69,570 10,913 $59,434 13,066 $55,137 9,366 $55,632 9,790 $52,465 8,852 10,441 12,598 8,980 9,391 8,382 $ $ 8.36 $ 5.69 $ $ 4.90 6.27 6.30 5.73 5.76 8.40 5.73 1.56 4.95 1.81 1.76 1.68 1.42 Statements of income Revenues Net income from continuing operations Net income from continuing operations attributable to Disney Per common share Earnings attributable to Disney Continuing Operations-Diluted Continuing Operations-Basic Dividends (6) Balance sheets Total assets Long-term obligations Disney shareholders' equity Statements of cash flows Cash provided (used) by - continuing operations: Operating activities Investing activities Financing activities $193,984 60,852 88,877 $98,598 24,797 48,773 $95,789 26,710 41,315 $92,033 24,189 43,265 $88,182 19,142 44,525 $ 5,984 (15,096) (464) $14,295 (5,336) (8,843) $12,343 (4,111) (8,959) $13,136 (5,758) (7,220) $11,385 (4,245) (5,801) EXHIBIT 3 Operating Results for Walt Disney's Parks, Experiences and Products Business Unit, Fiscal Years 2018-2019 (in millions) 2019 2018 Revenues Theme park admissions Parks & Experiences merchandise, food and beverage Resorts and vacations Merchandise licensing and retail Parks licensing and other Total revenues Operating expenses Selling, general, administrative and other Depreciation and amortization Equity in the loss of investees Operating Income $7,183 5,674 5,938 4,249 1,657 24,701 13,326 2,930 2,327 23 $6,095 $6,504 5,154 5,378 4,494 1,494 23,024 12,455 2,896 2,161 25 $5,487 EXHIBIT 5 Operating Results for Walt Disney's Media Networks Business Unit, Fiscal Years 2015-2019 (in millions) Revenues 2019 2018 2017 2016 2015 Affiliate fees Advertising TV/SVOD distribution and other Total revenues Operating expenses Selling, general, administrative and other Depreciation and amortization Equity in the income of investees Operating Income $11,907 6,586 3,429 21,922 13,197 1,899 $11,324 6,938 3,037 21,299 12,754 1,909 206 (766) $ 7,196 $12,659 8,129 2,722 23,510 14,068 2,647 237 (344) $ 6,902 $12,259 8,509 2,921 23,689 13,571 2,705 255 (597) $ 7,755 $12,029 8,361 2,874 23,264 13,150 2,869 266 (814) $ 7,793 199 (711) $ 7,338 EXHIBIT 6 Operating Results for Walt Disney's Direct-to- Consumer & International Business Unit, Fiscal Years 2018-2019 (in millions) 2019 2018 Revenues Affiliate fees Advertising Subscription fees and other Total revenues Operating expenses Selling, general, administrative and other Depreciation and amortization Equity in the income of investees Operating Income $1,372 1,311 731 3,414 2,384 $1,335 1,293 447 3,075 1,983 861 1,003 185 94 580 421 $ (284) $ (738) EXHIBIT 7 Operating Results for Walt Disney's Studio Entertainment Business Unit, Fiscal Years 2015-2019 (in millions) 2019 2018 2017 2016 2015 Revenues Theatrical distribution Home entertainment TV/SVOD distribution and other 4,726 1,734 4,667 11,127 5,187 3,119 135 $2,686 Total revenues $4,303 1,647 4,115 10,065 4,449 2,493 119 $3,004 $2,903 1,798 3,678 8,379 3,667 2,242 115 $3,672 2,108 3,661 9,441 3,991 2,622 $2,321 1,799 3,246 7,366 3,050 2,204 139 $1,973 Operating expenses Selling, general, administrative and other Depreciation and amortization Operating Income 125 $2,355 $2,703 EXHIBIT 8 Consolidated Statements of Income for The Walt Disney Company, Fiscal Years 2017-2019 (in millions, except per share data) 2019 2018 2017 Revenues Services Products $60,542 9,028 69,570 $50,869 8,565 59,434 $46,843 8,294 55,137 Total revenues Costs and expenses: Cost of services (exclusive of depreciation and amortization) Cost of products (exclusive of depreciation and amortization) Selling, general, administrative and other Depreciation and amortization Total costs and expenses 36,450 5,568 11,541 4,160 57,719 27,528 5,198 8,860 3,011 (4,597) 25,320 4,986 8,176 2,782 41,264 EXHIBIT 9 Consolidated Balance Sheets for The Walt Disney Company, Fiscal Years 2018 and 2019 (in millions, except per share data) September 28, 2019 September 29, 2018 ASSETS Current assets Cash and cash equivalents Receivables Inventories Television costs and advances Other current assets Total current assets Film and television costs Investments $ 5,418 15,481 1,649 4,597 979 28,124 22,810 3,224 $ 4,150 9,334 1,392 1,314 635 16,825 7,888 2,899 CASE 21 The Walt Disney Company: Its Diversification Strategy in 2020 C-291 September 28, 2019 September 29, 2018 Parks, resorts and other property Attractions, buildings and equipment Accumulated depreciation Projects in progress Land 58,589 (32,415) 26,174 4,264 1,165 31,603 23,215 80,293 4,715 $ 193,984 55,238 (30,764) 24,474 3,942 1,124 29,540 6,812 31,269 3,365 $98,598 Intangible assets, net Goodwill Other assets Total assets LIABILITIES AND EQUITY Current liabilities Accounts payable and other accrued liabilities Current portion of borrowings Deferred revenue and other Total current liabilities Borrowings $ 17,762 8,857 4,722 31,341 38,129 $ 9,479 3,790 4,591 17,860 17.084 EXHIBIT 9 Consolidated Balance Sheets for The Walt Disney Company, Fiscal Years 2018 and 2019 (in millions, except per share data) September 28, 2019 September 29, 2018 ASSETS Current assets Cash and cash equivalents Receivables Inventories $ Television costs and advances 5,418 15,481 1,649 4,597 979 28,124 22,810 3,224 $ 4,150 9,334 1,392 1,314 635 16,825 7,888 2,899 Other current assets Total current assets Film and television costs Investments September 28, 2019 September 29, 2018 Parks, resorts and other property Attractions, buildings and equipment Accumulated depreciation Projects in progress Land 58,589 (32,415) 26,174 4,264 1,165 31,603 23,215 80,293 4,715 $193,984 55,238 (30,764) 24,474 3,942 1,124 29,540 6,812 31,269 3,365 $98,598 $ 17,762 8,857 4,722 31,341 38,129 7,902 13,760 $ 9,479 3,790 4,591 17,860 17,084 3,109 6,590 Intangible assets, net Goodwill Other assets Total assets LIABILITIES AND EQUITY Current liabilities Accounts payable and other accrued liabilities Current portion of borrowings Deferred revenue and other Total current liabilities Borrowings Deferred income taxes Other long-term liabilities Commitments and contingencies Redeemable noncontrolling interests Equity Preferred stock Common stock, $.01 par value, Authorized-4.6 billion shares, Issued-1.8 billion shares at September 28, 2019 and 2.9 billion shares at September 29, 2018 Retained earnings Accumulated other comprehensive loss Treasury stock, at cost, 19 million shares at September 28, 2019 and 1.4 billion shares at September 29, 2018 Total Disney Shareholders' equity Noncontrolling interests Total equity Total liabilities and equity 8,963 1,123 53,907 42,494 (6,617) 36,779 82,679 (3,097) (907) 88,877 5,012 93,889 $193,984 (67,588) 48,773 4,059 52,832 $98,598


