What is your evaluation of Sirius XMs financial performance during the 20102013 period (as shown in case Exhibit 2)? Cite relevant financial ratios and include your own tables/figures as appropriate.
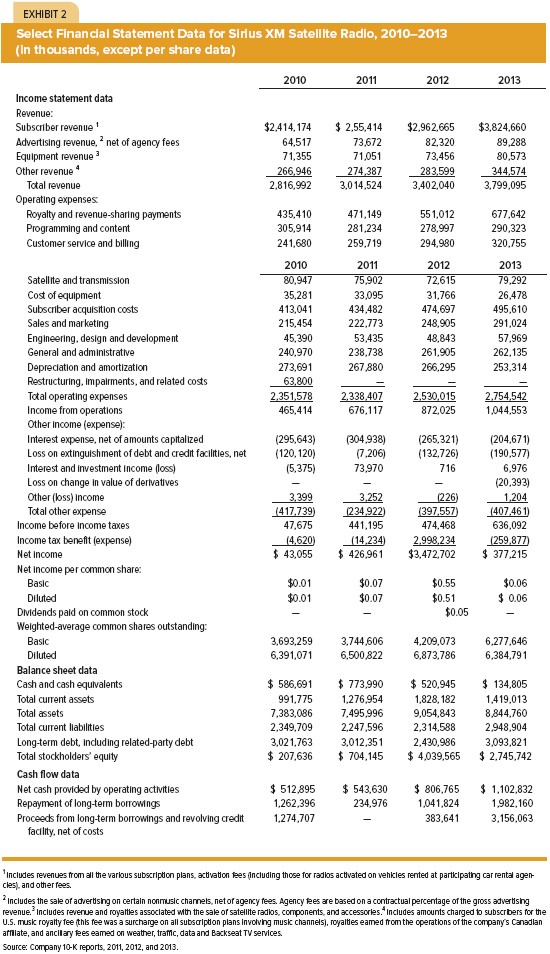
EXHIBIT Select Financial Statement Data for Sirlus XM Satellte Radio, 2010-2013 (In thousands, except per share data) 2010 2011 2012 2013 ncome statement data Revenue $2,414,174 2,55,414 $2.962.665 $3,824,660 Subscriber reve nu Advertising revenue, net of agency fee 64,517 73672 82,320 89,288 Equipment revenue 3 71,355 71,0 51 73,456 80,573 Other revenue 266,946 274,387 283,599 344,574 2,816.992 Total revenue 3,014,524 3,402,040 3,799,095 Operating expenses Royalty and revenue-sharing payments 435,410 471.149 551 012 677.642 Programming and content 305,914 281,234 278,997 290.323 Customer service and billing 241,680 259.719 294,980 320.755 2010 2011 2012 2013 atellite and transmission 80,947 75,902 72,615 79,292 Cost of equipment 35.281 33,095 31,766 26,478 Subscriber acquisition costs 413,041 434,482 474,697 495,610 Sales and marketing 215,454 222,773 248,905 291.024 Engineering, design and development 45,390 53,435 48,843 57.969 General and administratve 240,970 238,738 261,905 262.135 Depreciation and amortization 273,691 267,880 266,295 253.314 Restructuring, impairments, and related costs 63,800 Total operating expense 2,351,578 338,407 2,520,015 2,754,542 ncome from operation 465,414 676.117 872,025 1,044,553 Other income (expense) nterest expense, net of amount capitalized 295,643 265,32 (204,671 oss on extinguishment of debt and credit facilitie net 20,120 132,726 (190,577) Interest and investment income loss) 5,375 73,970 716 6.976 oss on change in value of dertwatives Other (loss 3.299 3,252 26 1,204 Come Total other expense 417,739 34,922 397,557 407,461 ncome before Income taxes 47,675 441,195 474,468 636,092 Income tax benefit (expense) 4,620 4,234) 2,998,234 259,8 43,055 426,961 $3,472,702 377.215 Net Income Net income per common share 4001 $0.07 $0.55 $0.06 Basic 5001 $0.07 $0.5 0.06 Diluted $0.05 Dividends paid on co on stock Weighted-average co mmon sha es outstanding Basic Diluted Balance sheet data 773990 520,945 134,805 Cash and cash equivalents 586,691 Total cument assets 991.775 1.276954 1,828,182 1.419.013 9.054,843 Total assets 7,383,086 7.495,996 8844.760 Total cument liabilitie 2,349,709 2,247,596 2,314,538 2948.904. Long-term debt, induding related-party debt 3,021,763 3,012,351 2,430,986 3,093,821 207,636 704.145 4,039,565 2,745,742 Total stockholders' equity Cash flow data Net cash provided by operating activitie Repayment of long-term bomowngs 1,274,707 Proceeds from long-term borrowings and revolving credit facility, net of costs ncludes revenues from all the various subscription plan activation ees including those for radios ac on Wehicles rented at participathg car rental agen- cies and other fees. ncludes the sale of advertising on certain nonmusic channels.netoragency fees Agency ees are basedon acontractual percentage of the gross advertisng revenue. ncludes revenue and royalties associated Mth the sale ofsatellite radios, components, and accessorie ncludes amounts charged b subscrbers for the U.S. music royalty fee this fee was a surcharge on all subsoription plans involving music channels, royalties eamed momthe operations of the companys Canadian affiate, and ancilaryees eamed on weather, tramc, data and BackseatTV services. Source: Company 10K reports. 2011, 2012, and 201 EXHIBIT Select Financial Statement Data for Sirlus XM Satellte Radio, 2010-2013 (In thousands, except per share data) 2010 2011 2012 2013 ncome statement data Revenue $2,414,174 2,55,414 $2.962.665 $3,824,660 Subscriber reve nu Advertising revenue, net of agency fee 64,517 73672 82,320 89,288 Equipment revenue 3 71,355 71,0 51 73,456 80,573 Other revenue 266,946 274,387 283,599 344,574 2,816.992 Total revenue 3,014,524 3,402,040 3,799,095 Operating expenses Royalty and revenue-sharing payments 435,410 471.149 551 012 677.642 Programming and content 305,914 281,234 278,997 290.323 Customer service and billing 241,680 259.719 294,980 320.755 2010 2011 2012 2013 atellite and transmission 80,947 75,902 72,615 79,292 Cost of equipment 35.281 33,095 31,766 26,478 Subscriber acquisition costs 413,041 434,482 474,697 495,610 Sales and marketing 215,454 222,773 248,905 291.024 Engineering, design and development 45,390 53,435 48,843 57.969 General and administratve 240,970 238,738 261,905 262.135 Depreciation and amortization 273,691 267,880 266,295 253.314 Restructuring, impairments, and related costs 63,800 Total operating expense 2,351,578 338,407 2,520,015 2,754,542 ncome from operation 465,414 676.117 872,025 1,044,553 Other income (expense) nterest expense, net of amount capitalized 295,643 265,32 (204,671 oss on extinguishment of debt and credit facilitie net 20,120 132,726 (190,577) Interest and investment income loss) 5,375 73,970 716 6.976 oss on change in value of dertwatives Other (loss 3.299 3,252 26 1,204 Come Total other expense 417,739 34,922 397,557 407,461 ncome before Income taxes 47,675 441,195 474,468 636,092 Income tax benefit (expense) 4,620 4,234) 2,998,234 259,8 43,055 426,961 $3,472,702 377.215 Net Income Net income per common share 4001 $0.07 $0.55 $0.06 Basic 5001 $0.07 $0.5 0.06 Diluted $0.05 Dividends paid on co on stock Weighted-average co mmon sha es outstanding Basic Diluted Balance sheet data 773990 520,945 134,805 Cash and cash equivalents 586,691 Total cument assets 991.775 1.276954 1,828,182 1.419.013 9.054,843 Total assets 7,383,086 7.495,996 8844.760 Total cument liabilitie 2,349,709 2,247,596 2,314,538 2948.904. Long-term debt, induding related-party debt 3,021,763 3,012,351 2,430,986 3,093,821 207,636 704.145 4,039,565 2,745,742 Total stockholders' equity Cash flow data Net cash provided by operating activitie Repayment of long-term bomowngs 1,274,707 Proceeds from long-term borrowings and revolving credit facility, net of costs ncludes revenues from all the various subscription plan activation ees including those for radios ac on Wehicles rented at participathg car rental agen- cies and other fees. ncludes the sale of advertising on certain nonmusic channels.netoragency fees Agency ees are basedon acontractual percentage of the gross advertisng revenue. ncludes revenue and royalties associated Mth the sale ofsatellite radios, components, and accessorie ncludes amounts charged b subscrbers for the U.S. music royalty fee this fee was a surcharge on all subsoription plans involving music channels, royalties eamed momthe operations of the companys Canadian affiate, and ancilaryees eamed on weather, tramc, data and BackseatTV services. Source: Company 10K reports. 2011, 2012, and 201


