

Answered step by step
Verified Expert Solution
Question
1 Approved Answer
what more information do you need? 1) As a marketing manager for Amazon, you want to analyze data comparing the time a customer spends browsing
what more information do you need?
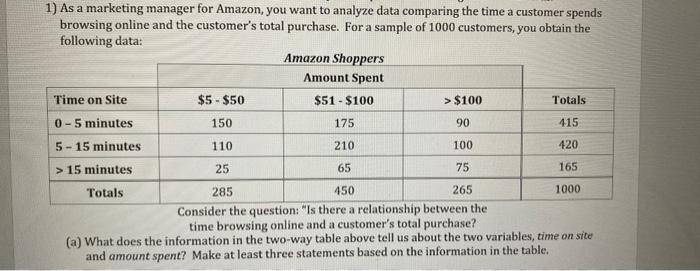
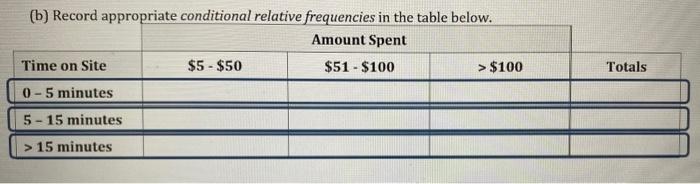
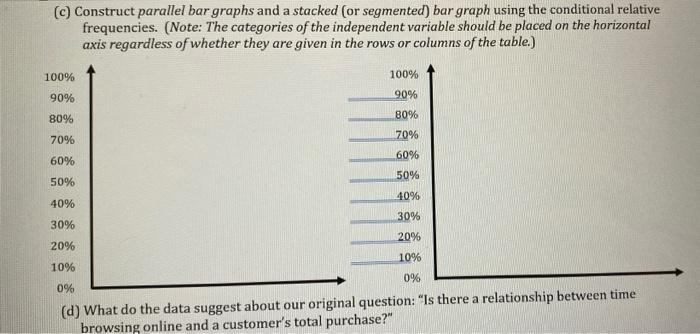
1) As a marketing manager for Amazon, you want to analyze data comparing the time a customer spends browsing online and the customer's total purchase. For a sample of 1000 customers, you obtain the following data: Amazon Shoppers Amount Spent Time on Site $5 - $50 $51 - $100 > $100 Totals 0-5 minutes 150 175 90 415 5 - 15 minutes 110 210 100 420 > 15 minutes 25 65 75 165 Totals 285 450 265 1000 Consider the question: "Is there a relationship between the time browsing online and a customer's total purchase? (a) What does the information in the two-way table above tell us about the two variables, time on site and amount spent? Make at least three statements based on the information in the table. (b) Record appropriate conditional relative frequencies in the table below. Amount Spent Time on Site $5 - $50 $51 - $100 > $100 0-5 minutes Totals 5 - 15 minutes > 15 minutes (c) Construct parallel bar graphs and a stacked (or segmented) bar graph using the conditional relative frequencies. (Note: The categories of the independent variable should be placed on the horizontal axis regardless of whether they are given in the rows or columns of the table.) 100% 100% 90% 90% 80% 80% 70% 70% 60% 60% 50% 40% 50% 40% 30% 20% 30% 20% 10% 10% 0% 0% (d) What do the data suggest about our original question: "Is there a relationship between time browsing online and a customer's total purchase?" 1) As a marketing manager for Amazon, you want to analyze data comparing the time a customer spends browsing online and the customer's total purchase. For a sample of 1000 customers, you obtain the following data: Amazon Shoppers Amount Spent Time on Site $5 - $50 $51 - $100 > $100 Totals 0-5 minutes 150 175 90 415 5 - 15 minutes 110 210 100 420 > 15 minutes 25 65 75 165 Totals 285 450 265 1000 Consider the question: "Is there a relationship between the time browsing online and a customer's total purchase? (a) What does the information in the two-way table above tell us about the two variables, time on site and amount spent? Make at least three statements based on the information in the table. (b) Record appropriate conditional relative frequencies in the table below. Amount Spent Time on Site $5 - $50 $51 - $100 > $100 0-5 minutes Totals 5 - 15 minutes > 15 minutes (c) Construct parallel bar graphs and a stacked (or segmented) bar graph using the conditional relative frequencies. (Note: The categories of the independent variable should be placed on the horizontal axis regardless of whether they are given in the rows or columns of the table.) 100% 100% 90% 90% 80% 80% 70% 70% 60% 60% 50% 40% 50% 40% 30% 20% 30% 20% 10% 10% 0% 0% (d) What do the data suggest about our original question: "Is there a relationship between time browsing online and a customer's total purchase Step by Step Solution
There are 3 Steps involved in it
Step: 1

Get Instant Access to Expert-Tailored Solutions
See step-by-step solutions with expert insights and AI powered tools for academic success
Step: 2

Step: 3
Ace Your Homework with AI
Get the answers you need in no time with our AI-driven, step-by-step assistance
Get Started
The Ascendancy Of Finance
Authors: Joseph Vogl, Simon Garnett
1st Edition
1509509305, 978-1509509300