Answered step by step
Verified Expert Solution
Question
1 Approved Answer
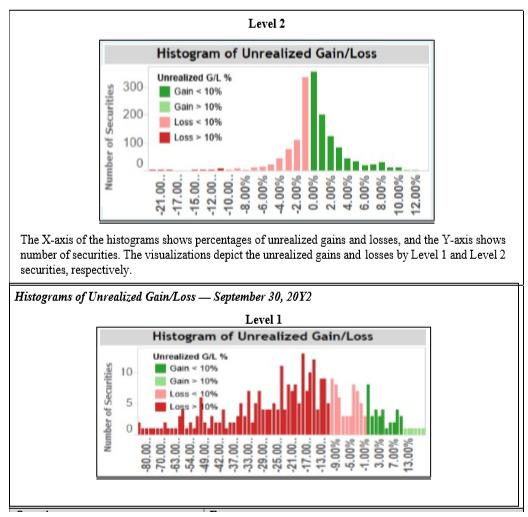
What types of procedures can be performed to evaluate what we are seeing relative to unrealized losses in the Level 1 securities? Level 2 Histogram
What types of procedures can be performed to evaluate what we are seeing relative to unrealized losses in the Level 1 securities?
Level 2 Histogram of Unrealized Gain/Loss Unrealized G/L % 300 Gain < 10% Gain > 10% 200 Loss 10% 100 Loss 10% The X-axis of the histograms shows percentages of unrealized gains and losses, and the Y-axis shows number of securities. The visualizations depict the unrealized gains and losses by Level 1 and Level 2 securities, respectively. Histograms of Unrealized Gain/Loss September 30, 20Y2 Level 1 Histogram of Unrealized Gain/Loss Unrealized GL % Gain - 10% Gain > 10% Loss- J0% Logaos 8888 Number of Securities Number of Securities -21.00. -17.00.. -15.00. -12.00.. -10.00.. -.00% %00'9- -29.00. -25.00. -21.00.. 17.00. 13.00.. %00 -2.00% %00'0 %00 %00 %00'9 %00'6 %00'S %00'L- %00'C %00'8 10.00% %00' %00'CL %00'7
Step by Step Solution
★★★★★
3.40 Rating (159 Votes )
There are 3 Steps involved in it
Step: 1
An unrealized loss is a paper loss that results from holding an asset that has decreased in price but not yet selling it and realizing the loss An inv...
Get Instant Access to Expert-Tailored Solutions
See step-by-step solutions with expert insights and AI powered tools for academic success
Step: 2

Step: 3

Ace Your Homework with AI
Get the answers you need in no time with our AI-driven, step-by-step assistance
Get Started


