Answered step by step
Verified Expert Solution
Question
1 Approved Answer
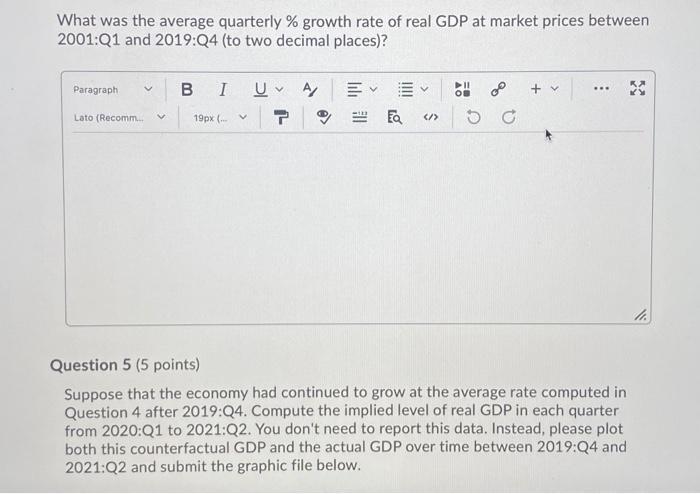
What was the average quarterly % growth rate of real GDP at market prices between 2001:Q1 and 2019:Q4 (to two decimal places)? Paragraph U


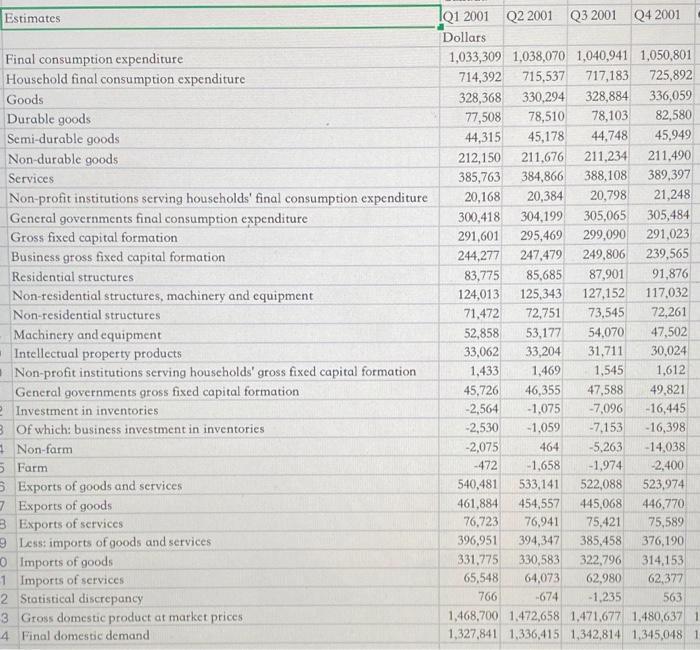
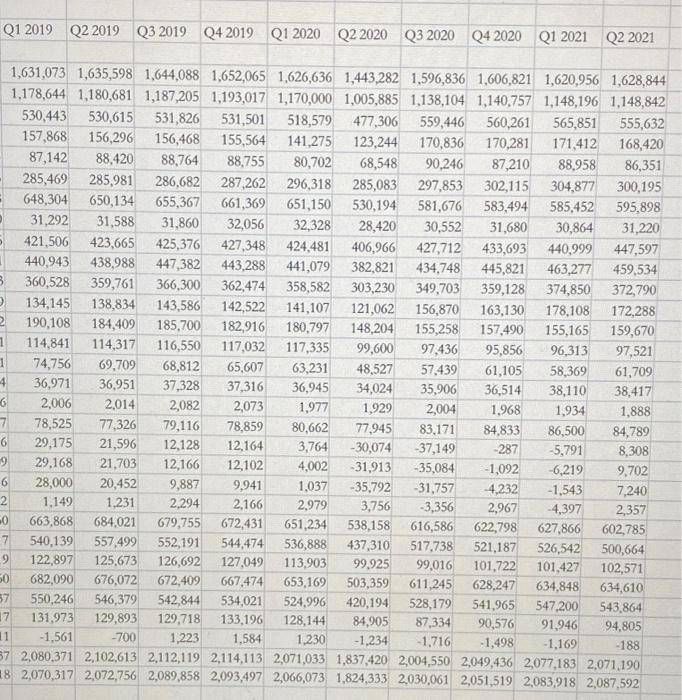
What was the average quarterly % growth rate of real GDP at market prices between 2001:Q1 and 2019:Q4 (to two decimal places)? Paragraph U + v Lato (Recomm. 19px (. Question 5 (5 points) Suppose that the economy had continued to grow at the average rate computed in Question 4 after 2019:Q4. Compute the implied level of real GDP in each quarter from 2020:Q1 to 2021:Q2. You don't need to report this data. Instead, please plot both this counterfactual GDP and the actual GDP over time between 2019:Q4 and 2021:Q2 and submit the graphic file below. > Estimates Q1 2001 Q2 2001 Q3 2001 Q4 2001 Dollars Final consumption expenditure 1,033,309 1,038,070 1,040,941 1,050,801 714,392 715,537 328,368 330,294 77,508 44,315 212,150 385,763 725,892 336,059 82,580 Household final consumption expenditure 717,183 Goods 328,884 78,510 78,103 Durable goods Semi-durable goods Non-durable goods 44,748 211,234 388,108 20,798 305,065 45,178 45,949 211,490 211,676 384,866 Services 389,397 20,384 21,248 Non-profit institutions serving households' final consumption expenditure Gencral governments final consumption expenditure Gross fixed capital formation Business gross fixed capital formation Residential structures 20,168 305,484 291,023 239,565 91,876 300,418 304,199 291,601 295,469 299,090 244,277 247,479 249,806 83,775 85,685 87,901 127,152 73,545 54,070 124,013 125,343 117,032 Non-residential structures, machinery and equipment Non-residential structures 71,472 72,751 72,261 53,177 47,502 Machinery and cquipment Intellectual property products Non-profit institutions serving households' gross fixed capital formation General governments gross fixed capital formation 2 Investment in inventories 3 Of which: business investment in inventories - Non-farm 5 Farm S Exports of goods and services 7 Exports of goods B Exports of services 9 Less: imports of goods and services O Imports of goods 1 Imports of services 2 Statistical discrepancy 3 Gross domestic product at market prices 4 Final domestic demand 52,858 30,024 33,062 1,433 45,726 -2,564 -2,530 -2,075 33,204 31,711 1,469 46,355 -1,075 1,545 1,612 47,588 49,821 -16,445 -16,398 -14,038 -2,400 523,974 446,770 75,589 376,190 -7,096 -7,153 -5,263 -1,059 464 -472 -1,658 -1,974 540,481 533,141 522,088 445,068 75,421 385,458 322,796 62,980 -1,235 1,468,700 1.472,658 1,471,677 1,480,637 1,327,841 1,336,415 1,342,814 1,345,048 1 461,884 454,557 76,723 76,941 394,347 330,583 396,951 331,775 314,153 65,548 64,073 62,377 766 -674 563 Q1 2019 Q2 2019 Q3 2019 Q4 2019 Q1 2020 Q2 2020 Q3 2020 Q4 2020 Q1 2021 Q2 2021 1,631,073 1,635,598 1,644,088 1,652,065 1,626,636 1,443,282 1,596,836 1,606,821 1,620,956 1,628,844 1,178,644 1,180,681 1,187,205 1,193,017 1,170,000 1,005,885 1,138,104 1,140,757 1,148,196 1,148,842 530,615 156,296 530,443 531,826 531,501 518,579 477,306 559,446 560,261 565,851 555,632 157,868 87,142 156,468 155,564 141,275 123,244 170,281 171,412 88,958 304,877 170,836 168,420 88,420 88,764 88,755 80,702 68,548 296,318 285,083 651,150 32,328 90,246 87,210 86,351 285,469 285,981 286,682 287,262 297,853 302,115 300,195 648,304 650,134 31,588 655,367 661,369 581,676 30,552 406,966 427,712 434,748 349,703 530,194 583,494 585,452 595,898 31,292 31,860 32,056 28,420 31,680 433,693 30,864 31,220 421,506 423,665 425,376 427,348 424,481 440,999 463,277 447,597 459,534 440,943 438,988 447,382 443,288 441,079 382,821 445,821 360,528 359,761 366,300 362,474 358,582 303,230 359,128 374,850 372,790 134,145 138,834 143,586 142,522 178,108 155,165 96,313 141,107 121,062 156,870 163,130 172,288 190,108 184,409 185,700 182,916 180,797 148,204 155,258 159,670 97,521 61,709 38,417 157,490 114,841 114,317 116,550 117,032 117,335 99,600 97,436 95,856 74,756 69,709 68,812 65,607 63,231 57,439 61,105 48,527 58,369 38,110 1,934 4 36,971 36,951 37,328 37,316 36,945 34,024 35,906 36,514 2,006 2,014 2,082 2,073 1,977 1,929 2,004 1,968 1,888 78,525 77,326 79,116 78,859 80,662 77,945 83,171 84,833 86,500 84,789 6 29,175 21,596 12,128 12,164 3,764 -30,074 -37,149 -5,791 -287 8,308 29,168 21,703 12,166 12,102 4,002 -31,913 -35,084 -1,092 -6,219 9,702 28,000 2 20,452 9,887 9,941 -31,757 -3,356 616,586 517,738 99,016 611,245 528,179 87,334 1,037 4,232 2,967 622,798 521,187 101,722 -35,792 -1,543 7,240 1,149 1,231 2,294 2,166 2,979 3,756 2,357 602,785 -4,397 663,868 684,021 679,755 672,431 651,234 538,158 627,866 526,542 557,499 125,673 676,072 672,409 546,379 129,893 7 540,139 552,191 544,474 536,888 113,903 653,169 437,310 500,664 122,897 126,692 127,049 99,925 503,359 102,571 634,610 543,864 94,805 101,427 682,090 57 550,246 131,973 17 11 667,474 628,247 634,848 542,844 534,021 524,996 420,194 541,965 129,718 1,223 547,200 91,946 -1,169 133,196 84,905 128,144 1,230 57 2,080,371 2,102,613 2,112,119 2,114,113 2,071,033 1,837,420 2,004,550 2,049,436 2,077,183 2,071,190 18 2,070,317 2,072,756 2,089,858 2,093,497 2,066,073 1,824,333 2,030,061 2,051,519 2,083,918 2,087,592 90,576 -1,498 -1,561 -700 1,584 -1,234 -1,716 -188 Question 4 (5 points) What was the average quarterly % growth rate of real GDP at market prices between 2001:Q1 and 2019:Q4 (to two decimal places)? What was the average quarterly % growth rate of real GDP at market prices between 2001:Q1 and 2019:Q4 (to two decimal places)? Paragraph U + v Lato (Recomm. 19px (. Question 5 (5 points) Suppose that the economy had continued to grow at the average rate computed in Question 4 after 2019:Q4. Compute the implied level of real GDP in each quarter from 2020:Q1 to 2021:Q2. You don't need to report this data. Instead, please plot both this counterfactual GDP and the actual GDP over time between 2019:Q4 and 2021:Q2 and submit the graphic file below. > Estimates Q1 2001 Q2 2001 Q3 2001 Q4 2001 Dollars Final consumption expenditure 1,033,309 1,038,070 1,040,941 1,050,801 714,392 715,537 328,368 330,294 77,508 44,315 212,150 385,763 725,892 336,059 82,580 Household final consumption expenditure 717,183 Goods 328,884 78,510 78,103 Durable goods Semi-durable goods Non-durable goods 44,748 211,234 388,108 20,798 305,065 45,178 45,949 211,490 211,676 384,866 Services 389,397 20,384 21,248 Non-profit institutions serving households' final consumption expenditure Gencral governments final consumption expenditure Gross fixed capital formation Business gross fixed capital formation Residential structures 20,168 305,484 291,023 239,565 91,876 300,418 304,199 291,601 295,469 299,090 244,277 247,479 249,806 83,775 85,685 87,901 127,152 73,545 54,070 124,013 125,343 117,032 Non-residential structures, machinery and equipment Non-residential structures 71,472 72,751 72,261 53,177 47,502 Machinery and cquipment Intellectual property products Non-profit institutions serving households' gross fixed capital formation General governments gross fixed capital formation 2 Investment in inventories 3 Of which: business investment in inventories - Non-farm 5 Farm S Exports of goods and services 7 Exports of goods B Exports of services 9 Less: imports of goods and services O Imports of goods 1 Imports of services 2 Statistical discrepancy 3 Gross domestic product at market prices 4 Final domestic demand 52,858 30,024 33,062 1,433 45,726 -2,564 -2,530 -2,075 33,204 31,711 1,469 46,355 -1,075 1,545 1,612 47,588 49,821 -16,445 -16,398 -14,038 -2,400 523,974 446,770 75,589 376,190 -7,096 -7,153 -5,263 -1,059 464 -472 -1,658 -1,974 540,481 533,141 522,088 445,068 75,421 385,458 322,796 62,980 -1,235 1,468,700 1.472,658 1,471,677 1,480,637 1,327,841 1,336,415 1,342,814 1,345,048 1 461,884 454,557 76,723 76,941 394,347 330,583 396,951 331,775 314,153 65,548 64,073 62,377 766 -674 563 Q1 2019 Q2 2019 Q3 2019 Q4 2019 Q1 2020 Q2 2020 Q3 2020 Q4 2020 Q1 2021 Q2 2021 1,631,073 1,635,598 1,644,088 1,652,065 1,626,636 1,443,282 1,596,836 1,606,821 1,620,956 1,628,844 1,178,644 1,180,681 1,187,205 1,193,017 1,170,000 1,005,885 1,138,104 1,140,757 1,148,196 1,148,842 530,615 156,296 530,443 531,826 531,501 518,579 477,306 559,446 560,261 565,851 555,632 157,868 87,142 156,468 155,564 141,275 123,244 170,281 171,412 88,958 304,877 170,836 168,420 88,420 88,764 88,755 80,702 68,548 296,318 285,083 651,150 32,328 90,246 87,210 86,351 285,469 285,981 286,682 287,262 297,853 302,115 300,195 648,304 650,134 31,588 655,367 661,369 581,676 30,552 406,966 427,712 434,748 349,703 530,194 583,494 585,452 595,898 31,292 31,860 32,056 28,420 31,680 433,693 30,864 31,220 421,506 423,665 425,376 427,348 424,481 440,999 463,277 447,597 459,534 440,943 438,988 447,382 443,288 441,079 382,821 445,821 360,528 359,761 366,300 362,474 358,582 303,230 359,128 374,850 372,790 134,145 138,834 143,586 142,522 178,108 155,165 96,313 141,107 121,062 156,870 163,130 172,288 190,108 184,409 185,700 182,916 180,797 148,204 155,258 159,670 97,521 61,709 38,417 157,490 114,841 114,317 116,550 117,032 117,335 99,600 97,436 95,856 74,756 69,709 68,812 65,607 63,231 57,439 61,105 48,527 58,369 38,110 1,934 4 36,971 36,951 37,328 37,316 36,945 34,024 35,906 36,514 2,006 2,014 2,082 2,073 1,977 1,929 2,004 1,968 1,888 78,525 77,326 79,116 78,859 80,662 77,945 83,171 84,833 86,500 84,789 6 29,175 21,596 12,128 12,164 3,764 -30,074 -37,149 -5,791 -287 8,308 29,168 21,703 12,166 12,102 4,002 -31,913 -35,084 -1,092 -6,219 9,702 28,000 2 20,452 9,887 9,941 -31,757 -3,356 616,586 517,738 99,016 611,245 528,179 87,334 1,037 4,232 2,967 622,798 521,187 101,722 -35,792 -1,543 7,240 1,149 1,231 2,294 2,166 2,979 3,756 2,357 602,785 -4,397 663,868 684,021 679,755 672,431 651,234 538,158 627,866 526,542 557,499 125,673 676,072 672,409 546,379 129,893 7 540,139 552,191 544,474 536,888 113,903 653,169 437,310 500,664 122,897 126,692 127,049 99,925 503,359 102,571 634,610 543,864 94,805 101,427 682,090 57 550,246 131,973 17 11 667,474 628,247 634,848 542,844 534,021 524,996 420,194 541,965 129,718 1,223 547,200 91,946 -1,169 133,196 84,905 128,144 1,230 57 2,080,371 2,102,613 2,112,119 2,114,113 2,071,033 1,837,420 2,004,550 2,049,436 2,077,183 2,071,190 18 2,070,317 2,072,756 2,089,858 2,093,497 2,066,073 1,824,333 2,030,061 2,051,519 2,083,918 2,087,592 90,576 -1,498 -1,561 -700 1,584 -1,234 -1,716 -188 Question 4 (5 points) What was the average quarterly % growth rate of real GDP at market prices between 2001:Q1 and 2019:Q4 (to two decimal places)?
Step by Step Solution
★★★★★
3.54 Rating (161 Votes )
There are 3 Steps involved in it
Step: 1
Towards question no 4 Real GDP for Q12001 1468700 P Real GDP fo...
Get Instant Access to Expert-Tailored Solutions
See step-by-step solutions with expert insights and AI powered tools for academic success
Step: 2

Step: 3

Ace Your Homework with AI
Get the answers you need in no time with our AI-driven, step-by-step assistance
Get Started


