Answered step by step
Verified Expert Solution
Question
1 Approved Answer
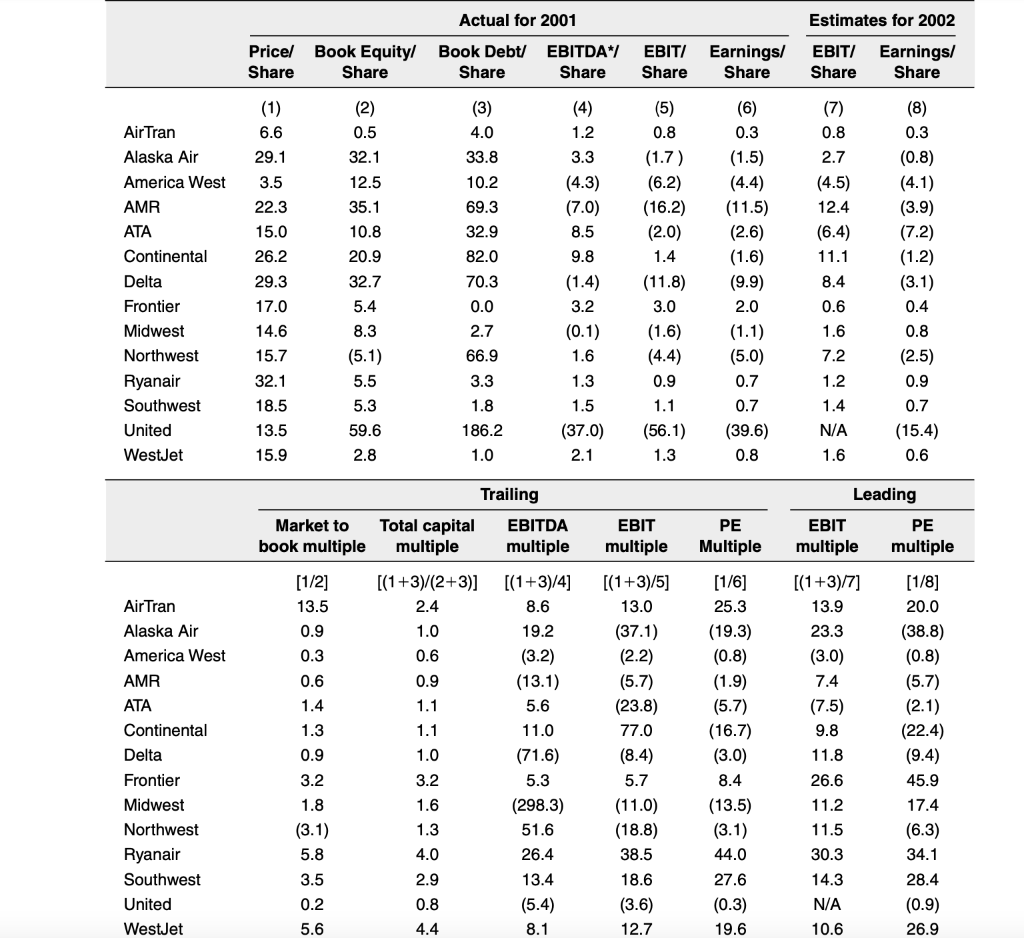
What was their trailing PE multiple. Take all the positive ones. 2. If the average multiple were to be applied to Jetblue, what should jetblues

What was their trailing PE multiple. Take all the positive ones.
2. If the average multiple were to be applied to Jetblue, what should jetblues price be?
Air Tran Alaska Air America West AMR ATA Continental Delta Frontier Midwest Northwest Ryanair Southwest United WestJet Air Tran Alaska Air America West AMR ATA Continental Delta Frontier Midwest Northwest Ryanair Southwest United WestJet Price/ Book Equity/ Share Share (1) 6.6 29.1 3.5 22.3 15.0 26.2 29.3 17.0 14.6 15.7 32.1 18.5 13.5 15.9 [1/2] 13.5 0.9 0.3 0.6 1.4 1.3 0.9 3.2 1.8 (3.1) 5.8 Market to book multiple 3.5 0.2 28 (2) 0.5 32.1 12.5 35.1 10.8 20.9 32.7 5.4 5.6 8.3 (5.1) 5.5 5.3 59.6 2.8 Actual for 2001 Book Debt/ EBITDA*/ EBIT/ Share Share Share Total capital multiple [(1+3)/(2+3)] 2.4 1.0 0.6 0.9 1.1 1.1 1.0 3.2 1.6 1.3 4.0 (3) 4.0 33.8 10.2 69.3 32.9 82.0 70.3 0.0 2.7 66.9 3.3 1.8 186.2 1.0 2.9 0.8 4.4 Trailing 3.3 (4.3) (7.0) 8.5 9.8 (1.4) 3.2 EBITDA multiple (4) 1.2 [(1+3)/4] 8.6 19.2 (3.2) (13.1) 5.6 11.0 (71.6) 5.3 (298.3) 51.6 26.4 13.4 (5.4) 8.1 (5) 0.8 (6) 0.3 (1.5) (4.4) (16.2) (11.5) (2.0) (2.6) 1.4 (1.6) (9.9) 2.0 (0.1) (1.6) 1.6 1.3 1.5 (37.0) 2.1 (1.7) (6.2) (11.8) 3.0 (1.1) (4.4) (5.0) 0.9 0.7 1.1 0.7 (56.1) (39.6) 1.3 0.8 EBIT multiple [(1+3)/5] 13.0 (37.1) (2.2) Earnings/ Share (5.7) (23.8) 77.0 (8.4) 5.7 (11.0) (18.8) 38.5 18.6 (3.6) 12.7 PE Multiple [1/6] 25.3 (19.3) (0.8) (1.9) (5.7) (16.7) (3.0) 8.4 (13.5) (3.1) 44.0 27.6 (0.3) 19.6 Estimates for 2002 EBIT/ Earnings/ Share Share (7) 0.8 2.7 (4.5) 12.4 (6.4) 11.1 8.4 0.6 1.6 7.2 1.2 1.4 N/A 1.6 (8) 0.3 [(1+3)/7] 13.9 23.3 (3.0) 7.4 (7.5) 9.8 11.8 26.6 11.2 11.5 30.3 14.3 N/A 10.6 (0.8) (4.1) (3.9) (7.2) (1.2) (3.1) 0.4 0.8 (2.5) 0.9 0.7 (15.4) 0.6 Leading EBIT PE multiple multiple [1/8] 20.0 (38.8) (0.8) (5.7) (2.1) (22.4) (9.4) 45.9 17.4 (6.3) 34.1 28.4 (0.9) 26.9 Air Tran Alaska Air America West AMR ATA Continental Delta Frontier Midwest Northwest Ryanair Southwest United WestJet Air Tran Alaska Air America West AMR ATA Continental Delta Frontier Midwest Northwest Ryanair Southwest United WestJet Price/ Book Equity/ Share Share (1) 6.6 29.1 3.5 22.3 15.0 26.2 29.3 17.0 14.6 15.7 32.1 18.5 13.5 15.9 [1/2] 13.5 0.9 0.3 0.6 1.4 1.3 0.9 3.2 1.8 (3.1) 5.8 Market to book multiple 3.5 0.2 28 (2) 0.5 32.1 12.5 35.1 10.8 20.9 32.7 5.4 5.6 8.3 (5.1) 5.5 5.3 59.6 2.8 Actual for 2001 Book Debt/ EBITDA*/ EBIT/ Share Share Share Total capital multiple [(1+3)/(2+3)] 2.4 1.0 0.6 0.9 1.1 1.1 1.0 3.2 1.6 1.3 4.0 (3) 4.0 33.8 10.2 69.3 32.9 82.0 70.3 0.0 2.7 66.9 3.3 1.8 186.2 1.0 2.9 0.8 4.4 Trailing 3.3 (4.3) (7.0) 8.5 9.8 (1.4) 3.2 EBITDA multiple (4) 1.2 [(1+3)/4] 8.6 19.2 (3.2) (13.1) 5.6 11.0 (71.6) 5.3 (298.3) 51.6 26.4 13.4 (5.4) 8.1 (5) 0.8 (6) 0.3 (1.5) (4.4) (16.2) (11.5) (2.0) (2.6) 1.4 (1.6) (9.9) 2.0 (0.1) (1.6) 1.6 1.3 1.5 (37.0) 2.1 (1.7) (6.2) (11.8) 3.0 (1.1) (4.4) (5.0) 0.9 0.7 1.1 0.7 (56.1) (39.6) 1.3 0.8 EBIT multiple [(1+3)/5] 13.0 (37.1) (2.2) Earnings/ Share (5.7) (23.8) 77.0 (8.4) 5.7 (11.0) (18.8) 38.5 18.6 (3.6) 12.7 PE Multiple [1/6] 25.3 (19.3) (0.8) (1.9) (5.7) (16.7) (3.0) 8.4 (13.5) (3.1) 44.0 27.6 (0.3) 19.6 Estimates for 2002 EBIT/ Earnings/ Share Share (7) 0.8 2.7 (4.5) 12.4 (6.4) 11.1 8.4 0.6 1.6 7.2 1.2 1.4 N/A 1.6 (8) 0.3 [(1+3)/7] 13.9 23.3 (3.0) 7.4 (7.5) 9.8 11.8 26.6 11.2 11.5 30.3 14.3 N/A 10.6 (0.8) (4.1) (3.9) (7.2) (1.2) (3.1) 0.4 0.8 (2.5) 0.9 0.7 (15.4) 0.6 Leading EBIT PE multiple multiple [1/8] 20.0 (38.8) (0.8) (5.7) (2.1) (22.4) (9.4) 45.9 17.4 (6.3) 34.1 28.4 (0.9) 26.9Step by Step Solution
There are 3 Steps involved in it
Step: 1

Get Instant Access to Expert-Tailored Solutions
See step-by-step solutions with expert insights and AI powered tools for academic success
Step: 2

Step: 3

Ace Your Homework with AI
Get the answers you need in no time with our AI-driven, step-by-step assistance
Get Started


