

Answered step by step
Verified Expert Solution
Question
1 Approved Answer
What would the cashflow diagram between each company look like? 1. Companics A and B have been offered the following rates per annum on a
What would the cashflow diagram between each company look like?
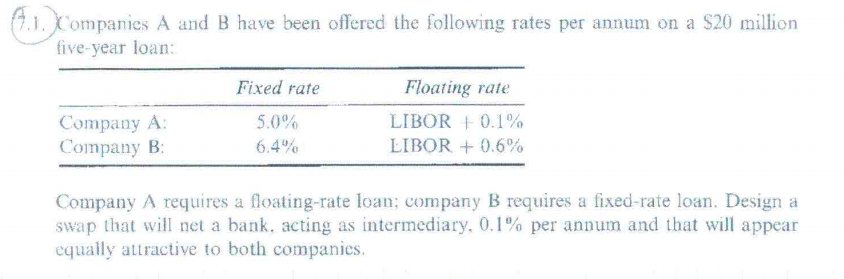
1. Companics A and B have been offered the following rates per annum on a S20 million five-year loan: Company A Company B Fixed rate 5.0%) 6.4% Floating rate LIBOR t 0.1% LIBOR + 0.6% Company A requires a floating-rate loan; company B requires a fixed-rate loan. Design a swap that will net a bank, acting as intermediary, 0.1% per annum and that will appear qualy atractive to both companicsStep by Step Solution
There are 3 Steps involved in it
Step: 1

Get Instant Access to Expert-Tailored Solutions
See step-by-step solutions with expert insights and AI powered tools for academic success
Step: 2

Step: 3
Ace Your Homework with AI
Get the answers you need in no time with our AI-driven, step-by-step assistance
Get Started
Candlestick Charts Training For Dummies
Authors: Walletter Books
1st Edition
979-8727316689